Don't miss the opportunity to build your house (or two) on this double lot near the eastside of Indianapolis minutes away from Downtown Indianapolis and the Historic Irvington. Several renovations completed in the block. Come check it out!
Pending
$45,000
112 N Denny St, Indianapolis, IN 46201
--beds
--baths
10,018Square Feet
Unimproved Land, Residential Lots
Built in ----
10,018 Square Feet Lot
$-- Zestimate®
$--/sqft
$-- HOA
What's special
Double lot
- 32 days
- 14
- 0
Zillow last checked:
Listing updated:
Listed by:
Mariah Hernandez magicreindy@gmail.com,
BluPrint Real Estate Group
Source: MIBOR as distributed by MLS GRID,MLS#: 22129555
Facts & features
Property
Lot
- Size: 10,018 Square Feet
- Features: City
- Topography: Level
Details
- Parcel number: 491004122020000101
- Zoning: Residential
- Zoning description: Single Family
- Horse amenities: None
Utilities & green energy
- Water: Municipal Water Near By
Community & HOA
Community
- Subdivision: Bradley Denny & Atkinson
HOA
- Has HOA: No
Location
- Region: Indianapolis
Financial & listing details
- Tax assessed value: $11,300
- Annual tax amount: $266
- Date on market: 10/2/2026
- Cumulative days on market: 30 days
- Road surface type: Asphalt
Estimated market value
Not available
Estimated sales range
Not available
Not available
Price history
| Date | Event | Price |
|---|---|---|
| 10/7/2026 | Pending sale | $45,000 |
Source:  MIBOR as distributed by MLS GRID #22129555 Report a problem | ||
| 10/2/2026 | Listed for sale | $45,000-30.8% |
Source: MIBOR as distributed by MLS GRID #22129555 Report a problem | ||
| 7/1/2026 | Listing removed | $65,000 |
Source: MIBOR as distributed by MLS GRID #22078658 Report a problem | ||
| 1/6/2026 | Listed for sale | $65,000 |
Source: MIBOR as distributed by MLS GRID #22078658 Report a problem | ||
| 1/1/2026 | Listing removed | $65,000 |
Source: MIBOR as distributed by MLS GRID #21948378 Report a problem | ||
| 4/15/2025 | Listed for sale | $65,000 |
Source: MIBOR as distributed by MLS GRID #21948378 Report a problem | ||
| 4/7/2025 | Pending sale | $65,000 |
Source: MIBOR as distributed by MLS GRID #21948378 Report a problem | ||
| 2/22/2024 | Price change | $65,000-11% |
Source: MIBOR as distributed by MLS GRID #21948378 Report a problem | ||
| 10/12/2023 | Listed for sale | $73,000+143.3% |
Source: MIBOR as distributed by MLS GRID #21948378 Report a problem | ||
| 3/24/2021 | Listing removed | -- |
Source: Owner Report a problem | ||
| 3/9/2018 | Listing removed | $30,000 |
Source: Owner Report a problem | ||
| 12/9/2017 | Listed for sale | $30,000+1255.6% |
Source: Owner Report a problem | ||
| 9/13/2017 | Sold | $2,213-50.8% |
Source: Public Record Report a problem | ||
| 2/14/2011 | Sold | $4,500-62.5% |
Source: MIBOR as distributed by MLS GRID #21100758 Report a problem | ||
| 1/8/2011 | Price change | $12,000-11.1% |
Source: foreclosure.com Report a problem | ||
| 12/27/2010 | Listed for sale | -- |
Source: foreclosure.com Report a problem | ||
| 3/10/2010 | Price change | $13,500-22.9% |
Source: Homefinder, Inc. #21009295 Report a problem | ||
| 2/28/2010 | Listed for sale | $17,500 |
Source: Homefinder, Inc. #21009295 Report a problem | ||
Public tax history
| Year | Property taxes | Tax assessment |
|---|---|---|
| 2025 | $268 -14.5% | $11,300 |
| 2024 | $313 -0.2% | $11,300 |
| 2023 | $314 -6.3% | $11,300 |
| 2022 | $335 +169.5% | $11,300 |
| 2021 | $124 -1.8% | $11,300 +169% |
| 2020 | $127 +93.9% | $4,200 |
| 2019 | $65 | $4,200 +100% |
| 2018 | -- | $2,100 |
| 2017 | $2,447 +5190.9% | $2,100 |
| 2016 | $46 +1.9% | $2,100 |
| 2014 | $45 -93.2% | $2,100 -93.1% |
| 2013 | $671 | $30,400 +1.7% |
| 2012 | $671 | $29,900 -14.6% |
| 2011 | -- | $35,000 |
| 2010 | $736 -2.3% | $35,000 |
| 2009 | $753 | $35,000 +24.1% |
| 2007 | -- | $28,200 +521.1% |
| 2001 | -- | $4,540 |
| 2000 | -- | $4,540 |
Find assessor info on the county website
Monthly payment
Est. payment
Payment breakdown
Explore the cost of this home by adjusting the details. Changes won't be saved.Climate risks
Neighborhood: Near Eastside
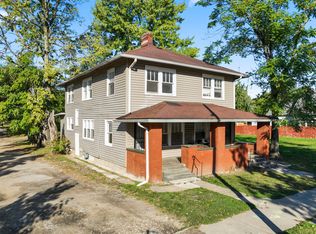
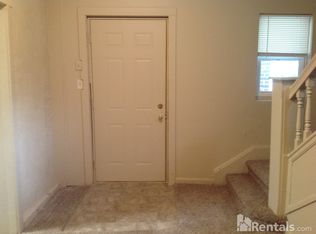
Similar homes
- $49,9004,356 sqft215 N Keystone Ave, Indianapolis, IN 46201Active
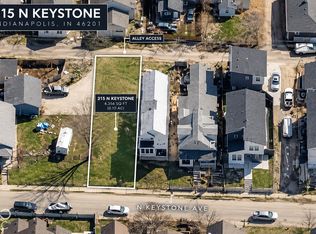 MLS ID #22132803, Dustin Kelly, Trueblood Real Estate. MIBOR as distributed by MLS GRID
- $55,0005,227 sqft232 N Temple Ave, Indianapolis, IN 46201Active
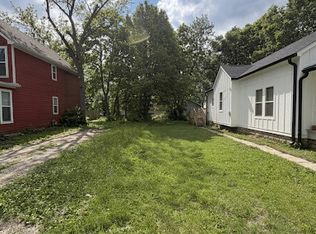 MLS ID #22098974, Maher Batarseh, F.C. Tucker Company. MIBOR as distributed by MLS GRID
- $57,5005,227 sqft69 S Lasalle St, Indianapolis, IN 46201Active
 MLS ID #22118455, Luke Granholm, @properties. MIBOR as distributed by MLS GRID
- $45,0005,227 sqft354 N Addison St, Indianapolis, IN 46222Active
 MLS ID #22132040, Evan Deal, eXp Realty, LLC. MIBOR as distributed by MLS GRID
