Bring your vision to 114 S Jefferson Street in downtown Ripley! Located near the town square, local shops, and everyday conveniences, this property has character, off-street parking, and an opportunity to customize the space to suit your needs. Hardwood flooring in portions of the building adds warmth, while parking at the front and rear provides practical access. Explore the potential for an investment property or a space combining living and working, subject to zoning and required approvals. An opportunity for ready to renovate and add their own finishing touches in an established downtown setting.
Active
$133,000
114 S Jefferson St, Ripley, TN 38063
6beds
4baths
2,159sqft
Multi Family
Built in 1920
-- sqft lot
$-- Zestimate®
$62/sqft
$-- HOA
What's special
Off-street parkingHardwood flooring
- 6 hours
- 40
- 7
Zillow last checked:
Listing updated:
Listed by:
Steve Koleno 804-656-5007,
Beycome Brokerage Realty, LLC 804-656-5007
Source: RealTracs MLS as distributed by MLS GRID,MLS#: 3633003
Facts & features
Interior
Bedrooms & bathrooms
- Bedrooms: 6
- Bathrooms: 4
Heating
- Central, Natural Gas
Cooling
- Central Air
Features
- Flooring: Carpet, Vinyl
Interior area
- Total structure area: 2,159
- Total interior livable area: 2,159 sqft
Property
Features
- Levels: One
- Stories: 1
Lot
- Size: 7,597 Square Feet
- Dimensions: 71 x 107
Details
- Parcel number: 095A B 01700 000
- Special conditions: Standard
Construction
Type & style
- Home type: MultiFamily
- Property subtype: Multi Family
- Attached to another structure: Yes
Condition
- New construction: No
- Year built: 1920
Utilities & green energy
- Utilities for property: Natural Gas Available
Community & HOA
Location
- Region: Ripley
Financial & listing details
- Price per square foot: $62/sqft
- Tax assessed value: $84,100
- Annual tax amount: $1,729
- Date on market: 11/5/2026
Estimated market value
Not available
Estimated sales range
Not available
Not available
Price history
| Date | Event | Price |
|---|---|---|
| 11/5/2026 | Listed for sale | $133,000-2.9%$62/sqft |
Source:  MAAR #10233863 Report a problem | ||
| 1/9/2026 | Listing removed | $137,000$63/sqft |
Source: MAAR #10197562 Report a problem | ||
| 8/22/2025 | Price change | $137,000-5.5%$63/sqft |
Source: MAAR #10197562 Report a problem | ||
| 7/25/2025 | Listed for sale | $145,000$67/sqft |
Source: MAAR #10197562 Report a problem | ||
| 7/20/2025 | Pending sale | $145,000$67/sqft |
Source: MAAR #10197562 Report a problem | ||
| 7/7/2025 | Price change | $145,000-4.5%$67/sqft |
Source: MAAR #10197562 Report a problem | ||
| 5/27/2025 | Listed for sale | $151,900+360.3%$70/sqft |
Source: MAAR #10197562 Report a problem | ||
| 4/2/2018 | Sold | $33,000$15/sqft |
Source: Public Record Report a problem | ||
Public tax history
| Year | Property taxes | Tax assessment |
|---|---|---|
| 2025 | $1,729 +7.2% | $33,640 +5.1% |
| 2024 | $1,613 | $32,000 |
| 2023 | $1,613 | $32,000 |
| 2022 | $1,613 | $32,000 |
| 2021 | -- | $32,000 +1.1% |
| 2020 | $1,742 | $31,640 |
| 2019 | $1,742 | $31,640 |
| 2018 | $1,742 0% | $31,640 |
| 2017 | $1,742 +2.5% | $31,640 |
| 2016 | $1,700 +2.2% | $31,640 |
| 2015 | $1,663 | $31,640 -6.9% |
| 2014 | $1,663 +68.7% | $34,000 0% |
| 2013 | $986 -38.2% | $34,008 |
| 2012 | $1,595 +5% | $34,008 |
| 2011 | $1,519 -8% | $34,008 -4.4% |
| 2009 | $1,651 | $35,587 |
| 2008 | $1,651 | $35,587 |
| 2007 | $1,651 +6.9% | $35,587 |
| 2006 | $1,544 +5.3% | $35,587 |
| 2005 | $1,466 +21.2% | $35,587 +8.9% |
| 2004 | $1,210 | $32,690 |
| 2002 | $1,210 | $32,690 |
| 2001 | -- | $32,690 -60% |
| 2000 | -- | $81,725 |
Find assessor info on the county website
Monthly payment
Est. payment
Payment breakdown
Explore the cost of this home by adjusting the details. Changes won't be saved.Climate risks
Neighborhood: 38063
Similar homes
- $156,0003 bd1 ba2k sqft179 Tucker Ave, Ripley, TN 38063For Sale
 MLS ID #10223144, Brian L Maclin, Unique Properties. MAAR
- $139,9993 bd1 ba1.1k sqft274 Joann St, Ripley, TN 38063For Sale
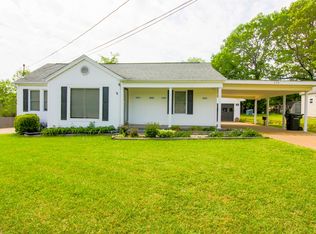 MLS ID #10219648, Tamara Harrald, Epique Realty. MAAR
- $140,0003 bd2 ba1.4k sqft320 Robin Dr, Ripley, TN 38063For Sale
 MLS ID #2601734, William Taylor, RE/MAX Realty Source. CWTAR
- $182,0003 bd2 ba1.3k sqft174 Tucker Ave, Ripley, TN 38063For Sale
 MLS ID #10228925, Tamara Harrald, Epique Realty. MAAR
- $100,0003 bd2 ba1.3k sqft2990 Junius Lee Rd, Ripley, TN 38063For Sale
 MLS ID #3611805, Sarah Harper Webb. RealTracs MLS as distributed by MLS GRID
