INVESTMENT OPPORTUNITY in West Roanoke. Home is intact and livable, but needs foundation, structural and mechanical work. Engineer's report in the supplements. Seller has never lived in the home and there is no seller's disclosure. Property being sold AS IS, no repairs, replacements or renegotiating. Price takes foundation & structural work needed into account.
Pending
$150,000
1218 W 38th St, Kansas City, MO 64111
4beds
1,696sqft
Single Family Residence
Built in 1903
4,581 Square Feet Lot
$-- Zestimate®
$88/sqft
$-- HOA
What's special
- 12 days
- 568
- 36
Likely to sell faster than
Zillow last checked:
Listing updated:
Listed by:
Stephanie Heiffus 816-645-5440,
Platinum Realty LLC
Source: Heartland MLS as distributed by MLS GRID,MLS#: 2648838
Facts & features
Interior
Bedrooms & bathrooms
- Bedrooms: 4
- Bathrooms: 1
- Full bathrooms: 1
Heating
- Forced Air
Cooling
- Other
Appliances
- Laundry: In Basement
Features
- Basement: Stone/Rock,Bath/Stubbed
- Number of fireplaces: 1
Interior area
- Total structure area: 1,696
- Total interior livable area: 1,696 sqft
- Finished area above ground: 1,696
- Finished area below ground: 0
Property
Parking
- Parking features: Carport
- Has carport: Yes
Lot
- Size: 4,581 Square Feet
Details
- Parcel number: 30320220600000000
Construction
Type & style
- Home type: SingleFamily
- Architectural style: Traditional
- Property subtype: Single Family Residence
Materials
- Vinyl Siding
- Roof: Composition
Condition
- Year built: 1903
Utilities & green energy
- Sewer: Public Sewer
- Water: Public
Community & HOA
Community
- Subdivision: West Roanoke
HOA
- Has HOA: Yes
Location
- Region: Kansas City
Financial & listing details
- Price per square foot: $88/sqft
- Tax assessed value: $264,500
- Annual tax amount: $4,215
- Date on market: 10/25/2026
- Listing terms: Cash,Other,Private Financing Available
- Exclusions: As Is
- Ownership: Private
Estimated market value
Not available
Estimated sales range
Not available
Not available
Price history
| Date | Event | Price |
|---|---|---|
| 10/30/2026 | Pending sale | $150,000$88/sqft |
Source:  Heartland MLS as distributed by MLS GRID #2648838 Report a problem | ||
| 10/26/2026 | Listed for sale | $150,000$88/sqft |
Source: Heartland MLS as distributed by MLS GRID #2648838 Report a problem | ||
Public tax history
| Year | Property taxes | Tax assessment |
|---|---|---|
| 2025 | $4,216 +8.1% | $50,255 +1.7% |
| 2024 | $3,901 +1% | $49,432 |
| 2023 | $3,865 +23.6% | $49,432 +30.1% |
| 2022 | $3,126 +0.3% | $38,000 |
| 2021 | $3,115 +3.9% | $38,000 +5.3% |
| 2020 | $2,997 +2.1% | $36,100 |
| 2019 | $2,935 | $36,100 +4.8% |
| 2018 | $2,935 +2.7% | $34,433 |
| 2017 | $2,856 +6.5% | $34,433 +2.6% |
| 2016 | $2,681 +1.4% | $33,569 +2% |
| 2014 | $2,645 +11.5% | $32,912 |
| 2013 | $2,373 +0.5% | $32,912 +13.1% |
| 2012 | $2,362 +0.1% | $29,093 |
| 2011 | $2,359 +0.9% | $29,093 |
| 2010 | $2,339 -3.5% | $29,093 |
| 2009 | $2,425 +0.5% | $29,093 -4% |
| 2008 | $2,413 -0.9% | $30,305 |
| 2007 | $2,436 +0% | $30,305 |
| 2006 | $2,435 +66.7% | $30,305 |
| 2005 | $1,461 +0.1% | $30,305 +63.6% |
| 2004 | $1,460 +14.3% | $18,524 |
| 2003 | $1,277 +0.3% | $18,524 +15% |
| 2002 | $1,274 +11.7% | $16,108 |
| 2001 | $1,140 | $16,108 |
Find assessor info on the county website
Monthly payment
Est. payment
Payment breakdown
Explore the cost of this home by adjusting the details. Changes won't be saved.Climate risks
Neighborhood: Volker


Similar homes
- $--6 bd3 ba1.8k sqft4024 Montgall Ave, Kansas City, MO 64130Auction
 ServiceLink Auction
- $220,0003 bd1 ba1.3k sqft4317 Fairmount St, Kansas City, MO 64111For Sale
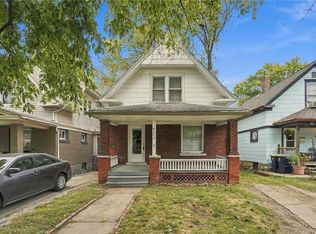 MLS ID #2648566, Jim Gamble, KW KANSAS CITY METRO. Heartland MLS as distributed by MLS GRID
- $169,5004 bd2 ba1.7k sqft5125 Euclid Ave, Kansas City, MO 64130For Sale
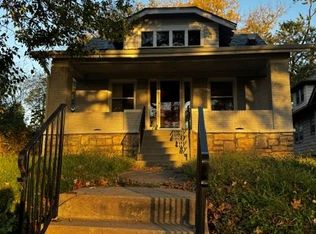 MLS ID #2649338, Lena Kalinichenko, BHHS Stein & Summers Real Estate. Heartland MLS as distributed by MLS GRID
- $149,5003 bd1 ba1.5k sqft3016 Agnes Ave, Kansas City, MO 64128For Sale
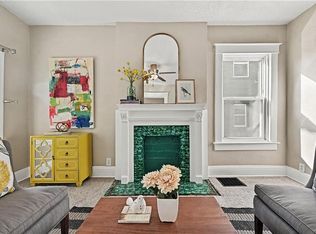 MLS ID #2646426, Veronica Jaster, ReeceNichols - Country Club Plaza. Heartland MLS as distributed by MLS GRID
