3 bed 1.5 bath Colonial with inground pool and child proof fence. Home offers additional family room off the kitchen, with skylights and sliding doors with access to the backyard. The garage has been converted and can be used as a 4th bedroom, playroom, or den. Home has plenty of storage space and is available for immediate occupancy. Located in a quiet neighborhood, close to shopping, schools and Garden State Parkway.
Pre-foreclosure
Est. $429,400
124 Windward Dr, Barnegat, NJ 08005
3beds
1baths
1,534sqft
SingleFamily
Built in 1973
6,534 Square Feet Lot
$429,400 Zestimate®
$280/sqft
$-- HOA
Overview
- 53 days
- 7
- 0
Facts & features
Interior
Bedrooms & bathrooms
- Bedrooms: 3
- Bathrooms: 1.5
Heating
- Forced air, Gas
Cooling
- Central
Appliances
- Included: Dishwasher, Refrigerator
Features
- Flooring: Carpet
Interior area
- Total interior livable area: 1,534 sqft
Property
Parking
- Total spaces: 1
- Parking features: Garage - Attached
Features
- Exterior features: Other
Lot
- Size: 6,534 Square Feet
Details
- Parcel number: 01001143100022
Construction
Type & style
- Home type: SingleFamily
- Architectural style: Colonial
Materials
- Frame
- Foundation: Concrete
- Roof: Asphalt
Condition
- Year built: 1973
Community & HOA
Location
- Region: Barnegat
Financial & listing details
- Price per square foot: $280/sqft
- Tax assessed value: $166,700
- Annual tax amount: $4,696
Foreclosure details
Estimated market value
$429,400
$404,000 - $455,000
$3,112/mo
Price history
| Date | Event | Price |
|---|---|---|
| 9/15/2024 | Listing removed | $410,000$267/sqft |
Source:  MoreMLS #22424886 Report a problem | ||
| 8/31/2024 | Listed for sale | $410,000$267/sqft |
Source: MoreMLS #22424886 Report a problem | ||
| 8/18/2024 | Listing removed | -- |
Source: MoreMLS #22423897 Report a problem | ||
| 8/17/2024 | Listed for sale | $410,000+10.8%$267/sqft |
Source: MoreMLS #22423897 Report a problem | ||
| 2/3/2023 | Sold | $370,000+5.7%$241/sqft |
Source: MoreMLS #22236644 Report a problem | ||
| 1/2/2023 | Pending sale | $349,999$228/sqft |
Source: MoreMLS #22236644 Report a problem | ||
| 12/15/2022 | Price change | $349,999-5.4%$228/sqft |
Source: MoreMLS #22236644 Report a problem | ||
| 12/4/2022 | Listed for sale | $370,000+245.8%$241/sqft |
Source: MoreMLS #22236644 Report a problem | ||
| 11/6/2019 | Listing removed | $1,750$1/sqft |
Source: Keller Williams Ocean Living #21938001 Report a problem | ||
| 10/3/2019 | Price change | $1,750-2.8%$1/sqft |
Source: Keller Williams Ocean Living #21938001 Report a problem | ||
| 8/10/2019 | Listed for rent | $1,800+5.9%$1/sqft |
Source: EXP Realty #21932821 Report a problem | ||
| 4/29/2017 | Listing removed | $1,700$1/sqft |
Source: Weichert Realtors Report a problem | ||
| 4/1/2017 | Listed for rent | $1,700$1/sqft |
Source: Weichert Co., REALTORS - SB #4026055 Report a problem | ||
| 1/24/2017 | Sold | $107,000-38.8%$70/sqft |
Source: Public Record Report a problem | ||
| 3/18/2004 | Sold | $174,900+215.1%$114/sqft |
Source: Public Record Report a problem | ||
| 9/25/1997 | Sold | $55,500$36/sqft |
Source: Public Record Report a problem | ||
Public tax history
| Year | Property taxes | Tax assessment |
|---|---|---|
| 2023 | $4,696 +0.5% | $166,700 |
| 2022 | $4,674 | $166,700 |
| 2021 | $4,674 +2% | $166,700 |
| 2020 | $4,584 +0.8% | $166,700 |
| 2019 | $4,549 +1.7% | $166,700 |
| 2018 | $4,474 +2.1% | $166,700 |
| 2017 | $4,383 +3.3% | $166,700 |
| 2016 | $4,244 +2.6% | $166,700 |
| 2015 | $4,136 +2.6% | $166,700 |
| 2014 | $4,029 +1.8% | $166,700 |
| 2013 | $3,957 -1% | $166,700 |
| 2012 | $3,996 -15.3% | $166,700 |
| 2011 | $4,719 +16.2% | $166,700 -33.1% |
| 2010 | $4,059 +2.3% | $249,000 +2.3% |
| 2009 | $3,968 +2.3% | $243,300 |
| 2008 | $3,878 +47.5% | $243,300 +239.8% |
| 2007 | $2,629 +0.6% | $71,600 |
| 2006 | $2,613 | $71,600 +4.2% |
| 2004 | -- | $68,700 |
| 2003 | -- | $68,700 |
| 2002 | -- | $68,700 |
| 2001 | -- | $68,700 |
Find assessor info on the county website
Monthly payment
Climate risks
Neighborhood: Lincoln Park

Similar homes
- $455,0004 bd3 ba1.7k sqft22 Compass Lane, Barnegat, NJ 08005For Sale

 MLS ID #22634985, Luke Graham, Reliable Realty LLC. MoreMLS
- $--3 bd2 ba1.8k sqft50 Bayside Ave, Barnegat, NJ 08005Auction
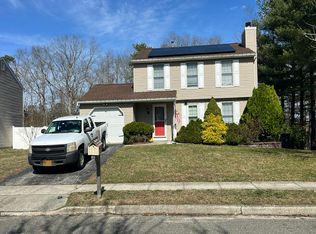 Auction.com 2
- $429,0004 bd3 ba1.7k sqft113 Barnegat Boulevard S, Barnegat, NJ 08005For Sale
 MLS ID #22623755, Steven Ace, RE/MAX Revolution. MoreMLS
- $405,0003 bd1 ba1.2k sqft56 Georgetown Blvd, Barnegat, NJ 08005For Sale
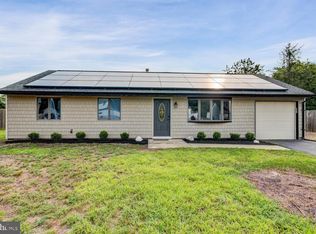
 MLS ID #NJOC2044554, Jessica DiFrancia, Keller Williams Realty - Atlantic Shore. Bright MLS
- $425,0004 bd3 ba1.8k sqft65 Barnegat Boulevard S, Barnegat, NJ 08005For SaleMLS ID #22631896, Laura Wicks, EXP Realty. MoreMLS
- $399,9003 bd1 ba1.6k sqft135 S Main St, Barnegat, NJ 08005For SaleMLS ID #NJOC2044502, Camille Simms, RE/MAX at Barnegat Bay - Toms River. Bright MLS
- $499,9993 bd3 ba1.8k sqft70 Bayside Dr, Barnegat, NJ 08005For SaleMLS ID #NJOC2046360, Gary Mawson, Jersey Property Group Realty. Bright MLS
- $424,9002 bd1 ba1.1k sqft155 Bay Shore Drive, Barnegat, NJ 08005For SaleMLS ID #22634187, George McGibbon, Weichert Realtors-Brick. MoreMLS
- $455,0002 bd2 ba1.8k sqft11 Robin Ln, Barnegat, NJ 08005For SaleMLS ID #NJOC2046130, Jake Smith, Better Homes and Gardens Real Estate Murphy & Co.. Bright MLS
- $364,9003 bd2 ba1.3k sqft35 Schooner Avenue, Barnegat, NJ 08005For SaleMLS ID #22623679, Jaime Aiello, Weichert Realtors-Ship Bottom. MoreMLS
- $469,0003 bd2 ba1.5k sqft12 Shelli Ter, Barnegat, NJ 08005For SaleMLS ID #NJOC2044658, Shea Spiegel, Imperial Real Estate Agency LLC. Bright MLS
- $499,9993 bd2 ba1.8k sqft26 Sparrow Lane, Barnegat, NJ 08005For SaleMLS ID #22634545, Ronnie Glomb, Your Town Realty. MoreMLS
- $389,0003 bd2 ba1.6k sqft623 E Bay Ave, Barnegat, NJ 08005For SaleMLS ID #NJOC2045410, Edward Ramiza, Coldwell Banker Home Connection. Bright MLS
- $429,9002 bd2 ba1.6k sqft17 Fountain View Dr, Barnegat, NJ 08005For Sale
 MLS ID #2770757M, ESTHERMARIE GALLICCHIO. All Jersey MLS
- $397,0003 bd2 ba2.1k sqft666 E Bay Ave, Barnegat, NJ 08005For SaleMLS ID #NJOC2045854, Laraine Acquaviva, Anchor Homes Real Estate. Bright MLS
- $450,0004 bd3 ba2k sqft64 1st St, Barnegat, NJ 08005For SaleMLS ID #2703511R, ROBERT DEKANSKI. All Jersey MLS
- $499,9003 bd2 ba1.4k sqft1072 W Bay Avenue, Barnegat, NJ 08005For SaleMLS ID #22632398, Gregory R Broome, RE/MAX at Barnegat Bay. MoreMLS
- $600,0003 bd2 ba1.5k sqft10 Red Coat Drive, Barnegat, NJ 08005For SaleMLS ID #22625130, Andrew Laumbach, RE/MAX Revolution. MoreMLS
