This home is a Real Estate Owned (REO)/Post Foreclosure. Once a lender has foreclosed on a property it is soon put up for public auction. If bids fall short of the asking price the bank will buy back the home and attempt to sell it on the open market. However, lenders are not real estate agents, meaning that they will often accept offers 30 to 60 percent less than market value!
Pre-foreclosure
Street View
Est. $245,900
13025 SW 63rd Ter, Ocala, FL 34473
3beds
2baths
1,800sqft
SingleFamily
Built in 2007
0.26 Acres Lot
$245,900 Zestimate®
$137/sqft
$8/mo HOA
Overview
- 47 days
- 16
- 1
Facts & features
Interior
Bedrooms & bathrooms
- Bedrooms: 3
- Bathrooms: 2
Heating
- Heat pump
Features
- Flooring: Softwood
Interior area
- Total interior livable area: 1,800 sqft
Property
Parking
- Parking features: Garage
Features
- Exterior features: Cement / Concrete
Lot
- Size: 0.26 Acres
Details
- Parcel number: 8010099201
Construction
Type & style
- Home type: SingleFamily
Materials
- Foundation: Slab
- Roof: Other
Condition
- Year built: 2007
Community & HOA
HOA
- Has HOA: Yes
- HOA fee: $8 monthly
Location
- Region: Ocala
Financial & listing details
- Price per square foot: $137/sqft
- Tax assessed value: $220,274
- Annual tax amount: $1,439
Foreclosure details
Estimated market value
$245,900
$229,000 - $261,000
$1,907/mo
Price history
| Date | Event | Price |
|---|---|---|
| 8/5/2009 | Sold | $112,500-2.1%$63/sqft |
Source: Public Record Report a problem | ||
| 4/22/2009 | Listed for sale | $114,900+91.5%$64/sqft |
Source: foreclosure.com Report a problem | ||
| 8/11/2006 | Sold | $60,000$33/sqft |
Source: Public Record Report a problem | ||
Public tax history
| Year | Property taxes | Tax assessment |
|---|---|---|
| 2025 | $1,439 +19.6% | $90,896 +2.9% |
| 2024 | $1,203 +3% | $88,334 +3% |
| 2023 | $1,168 +5.6% | $85,761 +3% |
| 2022 | $1,106 +1.6% | $83,263 +3.3% |
| 2021 | $1,088 +1.2% | $80,638 +1.4% |
| 2020 | $1,076 +2.1% | $79,525 +2.3% |
| 2019 | $1,053 | $77,737 +1.9% |
| 2018 | $1,053 +6.2% | $76,288 +2.1% |
| 2017 | $992 +1.7% | $74,719 +2.1% |
| 2016 | $975 | $73,182 +0.7% |
| 2015 | $975 +4.3% | $72,673 +0.8% |
| 2014 | $935 +1.3% | $72,096 +1.5% |
| 2013 | $923 -0.6% | $71,031 -0.1% |
| 2012 | $929 -2.5% | $71,085 -4.7% |
| 2011 | $952 -30.4% | $74,588 -25.4% |
| 2010 | $1,368 -44.9% | $100,012 -24.3% |
| 2009 | $2,484 -9.2% | $132,060 -12.2% |
| 2008 | $2,737 +317.8% | $150,373 +275.9% |
| 2007 | $655 +53.5% | $40,000 +77.8% |
| 2006 | $427 +235.6% | $22,500 +125% |
| 2005 | $127 | $10,000 +100% |
| 2004 | $127 -17.9% | $5,000 |
| 2002 | $155 +3.5% | $5,000 |
| 2001 | $150 | $5,000 |
| 2000 | $150 | $5,000 |
Find assessor info on the county website
Monthly payment
Climate risks
Neighborhood: 34473

Similar homes
- $249,0003 bd2 ba1.9k sqft13076 SW 78TH TERRACE, OCALA, FL 34473For Sale

 MLS ID #OM725661, Aurora Poll, ROBERTS REAL ESTATE INC. Stellar MLS
- $250,0003 bd2 ba2k sqft818 MARION OAKS MANOR, OCALA, FL 34473For Sale
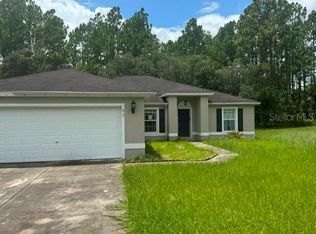 MLS ID #G5115597, Paul Lemieux II, PA, KELLER WILLIAMS CORNERSTONE RE. Stellar MLS
- $265,0004 bd2 ba1.8k sqft5325 SW 129TH PLACE, OCALA, FL 34473For Sale
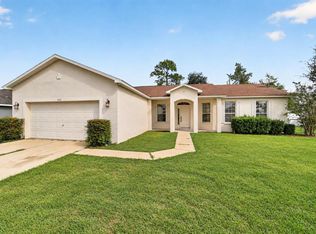 MLS ID #G5117584, Robin Lis, DOWN HOME REALTY, LLLP. Stellar MLS
- $239,0003 bd2 ba1.3k sqft5209 SW 128TH PLACE, OCALA, FL 34473For Sale
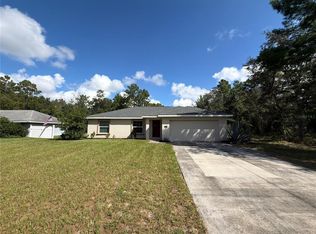 MLS ID #O6444673, Karen Albright, OPENDOOR BROKERAGE LLC. Stellar MLS
- $259,0003 bd2 ba1.8k sqft304 MARION OAKS TRAIL, OCALA, FL 34473For SaleMLS ID #OM728987, Shirley Velasco, HOOK & LADDER REALTY OF CENTRAL FLORIDA, LLC. Stellar MLS
- $244,9993 bd2 ba1k sqft13473 SW 60TH AVENUE ROAD, OCALA, FL 34473For SaleMLS ID #S5160067, Adan Ordonez, ADAN INVESTMENTS REAL ESTATE GROUP, PLLC. Stellar MLS
- $230,0003 bd2 ba1.5k sqft4731 SW 138TH LOOP, OCALA, FL 34473For SaleMLS ID #OM733974, Victoria Worth, BERKSHIRE HATHAWAY HS FLORIDA. Stellar MLS
- $260,0003 bd2 ba1.3k sqft6361 SW 129TH STREET, OCALA, FL 34473New ConstructionStellar MLS
- $259,9003 bd2 ba1.4k sqft4660 SW 130TH STREET, OCALA, FL 34473For SaleMLS ID #OM727986, Alberto Rodriguez, CENTRAL CITY REALTY. Stellar MLS
- $265,0004 bd2 ba1.6k sqft4838 SW 139TH PLACE, OCALA, FL 34473For SaleMLS ID #OM733419, Garrett Huffman, EXP REALTY LLC. Stellar MLS
- $299,0003 bd2 ba1.6k sqft13152 SW 65TH CIRCLE, OCALA, FL 34473For SaleMLS ID #OM731023, Lauren Uitts, ROYAL OAK REALTY LLC. Stellar MLS
- $289,0003 bd2 ba1.7k sqft6417 SW 143RD LANE ROAD, OCALA, FL 34473For SaleMLS ID #OM730537, Navin Singh, SINGH REAL ESTATE SERVICES. Stellar MLS
- $254,9003 bd2 ba1.7k sqft11585 SW 72ND CIRCLE, OCALA, FL 34476For SaleMLS ID #OM731940, Nidia Uribe Montoya, MARCILLO REAL ESTATE LLC. Stellar MLS
- $308,9003 bd2 ba1.7k sqft6577 SW 131ST PLACE, OCALA, FL 34473New ConstructionMLS ID #OM734926, William Stiles, LOKATION. Stellar MLS
- $290,0004 bd2 ba1.6k sqft13338 SW 48TH AVENUE, OCALA, FL 34473For SaleMLS ID #O6411061, Yolanda Aponte PA, KINGDOM KEY GROUP LLC. Stellar MLS
- $249,9903 bd2 ba1.3k sqft13244 SW 49TH AVENUE, OCALA, FL 34473For SaleMLS ID #S5155383, Gian Balsamo, LA ROSA REALTY KISSIMMEE. Stellar MLS
- $279,0003 bd2 ba1.5k sqft14535 SW 68TH TERRACE, OCALA, FL 34473For SaleMLS ID #OM728127, Craig Heron, REAL BROKER, LLC. Stellar MLS
- $270,0004 bd2 ba1.5k sqft835 MARION OAKS MANOR, OCALA, FL 34473For SaleMLS ID #OM728326, Hilda Puga, GLOBALWIDE REALTY LLC. Stellar MLS
- $279,8994 bd2 ba1.6k sqft6986 SW 128TH STREET, OCALA, FL 34473New ConstructionMLS ID #O6450664, Soraya Resende, S2J REALTY, LLC. Stellar MLS
