This 1375 square foot single family home has 3 bedrooms and 1.5 bathrooms. This home is located at 1316 S 8th Ave, Maywood, IL 60153.
Foreclosed
Est. $189,500
1316 S 8th Ave, Maywood, IL 60153
3beds
1baths
1,375sqft
SingleFamily
Built in 1876
9,583 Square Feet Lot
$-- Zestimate®
$138/sqft
$-- HOA
Overview
- 69 days
- 37
- 6
Facts & features
Interior
Bedrooms & bathrooms
- Bedrooms: 3
- Bathrooms: 1.5
Heating
- Forced air, Gas
Cooling
- None
Appliances
- Included: Dishwasher, Microwave, Range / Oven, Refrigerator
Features
- Flooring: Tile, Hardwood
Interior area
- Total interior livable area: 1,375 sqft
Property
Parking
- Total spaces: 3
- Parking features: Garage - Detached
Features
- Exterior features: Vinyl
Lot
- Size: 9,583 Square Feet
Details
- Parcel number: 1514124012
Construction
Type & style
- Home type: SingleFamily
Materials
- Frame
- Roof: Shake / Shingle
Condition
- Year built: 1876
Utilities & green energy
- Sewer: Sewer-Public, Sewer-Storm
Community & HOA
Location
- Region: Maywood
Financial & listing details
- Price per square foot: $138/sqft
- Tax assessed value: $189,500
- Annual tax amount: $8,850
Foreclosure details
Estimated market value
Not available
Estimated sales range
Not available
$1,801/mo
Price history
| Date | Event | Price |
|---|---|---|
| 6/1/2026 | Listing removed | $195,000$142/sqft |
Source:  MRED as distributed by MLS GRID #12205272 Report a problem | ||
| 5/22/2026 | Contingent | $195,000$142/sqft |
Source: MRED as distributed by MLS GRID #12205272 Report a problem | ||
| 5/20/2026 | Listing removed | $195,000$142/sqft |
Source: MRED as distributed by MLS GRID #12205272 Report a problem | ||
| 10/7/2025 | Contingent | $195,000$142/sqft |
Source: MRED as distributed by MLS GRID #12205272 Report a problem | ||
| 9/9/2025 | Price change | $195,000-5.8%$142/sqft |
Source: MRED as distributed by MLS GRID #12205272 Report a problem | ||
| 5/28/2025 | Price change | $207,000-2.4%$151/sqft |
Source: MRED as distributed by MLS GRID #12205272 Report a problem | ||
| 5/13/2025 | Listed for sale | $212,000+24.7%$154/sqft |
Source: MRED as distributed by MLS GRID #12205272 Report a problem | ||
| 1/13/2025 | Contingent | $170,000$124/sqft |
Source: MRED as distributed by MLS GRID #12205272 Report a problem | ||
| 12/29/2024 | Price change | $170,000-10.1%$124/sqft |
Source: MRED as distributed by MLS GRID #12205272 Report a problem | ||
| 12/16/2024 | Price change | $189,000-10%$137/sqft |
Source: MRED as distributed by MLS GRID #12205272 Report a problem | ||
| 11/7/2024 | Listed for sale | $210,000+26.5%$153/sqft |
Source: MRED as distributed by MLS GRID #12205272 Report a problem | ||
| 6/19/2019 | Sold | $166,000-2.3%$121/sqft |
Source: MRED as distributed by MLS GRID #10109036 Report a problem | ||
| 4/16/2019 | Pending sale | $169,900$124/sqft |
Source: RAJ Realty & Investment Co. #10109036 Report a problem | ||
| 10/11/2018 | Listed for sale | $169,900+239.8%$124/sqft |
Source: RAJ Realty & Investment Co. #10109036 Report a problem | ||
| 4/21/2017 | Listing removed | $1,350$1/sqft |
Source: Owner Report a problem | ||
| 4/3/2017 | Price change | $1,350-10%$1/sqft |
Source: Owner Report a problem | ||
| 3/23/2017 | Listed for rent | $1,500$1/sqft |
Source: Owner Report a problem | ||
| 1/12/1999 | Sold | $50,000$36/sqft |
Source: Public Record Report a problem | ||
Public tax history
| Year | Property taxes | Tax assessment |
|---|---|---|
| 2024 | $8,850 +8.4% | $18,950 +0% |
| 2023 | $8,164 -12% | $18,949 +15.1% |
| 2022 | $9,272 -0.4% | $16,469 |
| 2021 | $9,310 +2.6% | $16,469 |
| 2020 | $9,077 +21.2% | $16,469 +39% |
| 2019 | $7,486 +2.8% | $11,849 |
| 2018 | $7,283 +3.5% | $11,849 |
| 2017 | $7,038 +173.6% | $11,849 +186.1% |
| 2016 | $2,572 -60.4% | $4,142 -63.1% |
| 2015 | $6,490 +9.4% | $11,211 |
| 2014 | $5,935 +9.6% | $11,211 +0.1% |
| 2013 | $5,417 +4.7% | $11,199 |
| 2012 | $5,174 +2.3% | $11,199 |
| 2011 | $5,058 -19.4% | $11,199 -30.7% |
| 2010 | $6,276 +1.4% | $16,166 |
| 2009 | $6,190 +5.4% | $16,166 -5% |
| 2008 | $5,875 +32.9% | $17,017 +34.9% |
| 2007 | $4,419 -14.9% | $12,618 -17.6% |
| 2006 | $5,192 +2.1% | $15,319 +1% |
| 2005 | $5,083 +27.3% | $15,171 +32.1% |
| 2004 | $3,992 +4.9% | $11,484 |
| 2003 | $3,806 -1.1% | $11,484 |
| 2002 | $3,849 +91.4% | $11,484 +39.3% |
| 2001 | $2,011 +3.3% | $8,244 |
| 2000 | $1,947 +19.6% | $8,244 |
| 1999 | $1,628 | $8,244 |
Find assessor info on the county website
Monthly payment
Climate risks
Neighborhood: 60153
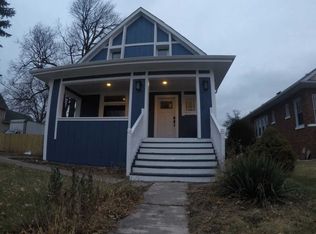
Similar homes
- $--3 bd1 ba1k sqft800 S 21st Ave, Maywood, IL 60153Auction
 ServiceLink Auction
- $210,0003 bd2 ba2k sqft1906 S 7th Ave, Maywood, IL 60153Active
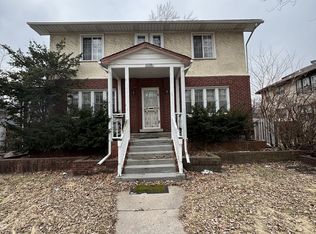 MLS ID #12613834, Gary Alveranga, Real People Realty. MRED as distributed by MLS GRID
- $200,0003 bd2 ba1.2k sqft1107 24th Ave, Bellwood, IL 60104Active
 MLS ID #12749104, Nikki Kimsey, Keller Williams Preferred Rlty. MRED as distributed by MLS GRID
- $198,0004 bd2 ba1.7k sqft533-535 Linden Ave, Bellwood, IL 60104Auction
 Xome
