This 1471 square foot single family home has 2 bedrooms and 2.0 bathrooms. This home is located at 13815 Sylvan St, Van Nuys, CA 91401.
Pre-foreclosure
Street View
Est. $979,400
13815 Sylvan St, Van Nuys, CA 91401
2beds
2baths
1,471sqft
SingleFamily
Built in 1947
7,405 Square Feet Lot
$979,400 Zestimate®
$666/sqft
$-- HOA
Overview
- 85 days
- 6
- 0
Facts & features
Interior
Bedrooms & bathrooms
- Bedrooms: 2
- Bathrooms: 2
Heating
- Wall
Interior area
- Total interior livable area: 1,471 sqft
Property
Parking
- Total spaces: 1
Lot
- Size: 7,405 Square Feet
Details
- Parcel number: 2239005037
Construction
Type & style
- Home type: SingleFamily
- Architectural style: Conventional
Condition
- Year built: 1947
Community & HOA
Location
- Region: Van Nuys
Financial & listing details
- Price per square foot: $666/sqft
- Tax assessed value: $751,606
Foreclosure details
Estimated market value
$979,400
$901,000 - $1.07M
$3,600/mo
Price history
| Date | Event | Price |
|---|---|---|
| 7/9/2015 | Listing removed | -- |
Source: Auction.com Report a problem | ||
| 6/17/2015 | Listed for sale | -- |
Source: Auction.com Report a problem | ||
| 4/30/2015 | Listing removed | -- |
Source: Auction.com Report a problem | ||
| 4/10/2015 | Price change | $603,363+9.7%$410/sqft |
Source: Auction.com Report a problem | ||
| 4/8/2015 | Listed for sale | -- |
Source: Auction.com Report a problem | ||
| 11/16/2006 | Sold | $550,000+304.4%$374/sqft |
Source: Public Record Report a problem | ||
| 11/4/1997 | Sold | $136,000$92/sqft |
Source: Public Record Report a problem | ||
| 8/15/1997 | Sold | $136,000$92/sqft |
Source: Public Record Report a problem | ||
Public tax history
| Year | Property taxes | Tax assessment |
|---|---|---|
| 2026 | -- | $751,606 +2% |
| 2025 | $9,057 +1.1% | $736,869 +2% |
| 2024 | $8,961 +2% | $722,422 +2% |
| 2023 | $8,789 +4.9% | $708,258 +2% |
| 2022 | $8,381 +1.3% | $694,372 +2% |
| 2021 | $8,277 -1% | $680,758 +1% |
| 2020 | $8,360 | $673,779 +2% |
| 2019 | $8,360 +5.5% | $660,569 +2% |
| 2018 | $7,928 | $647,618 +2% |
| 2017 | $7,928 +2.3% | $634,920 +3.2% |
| 2016 | $7,753 +3.6% | $615,000 +3% |
| 2015 | $7,486 +0.6% | $597,000 |
| 2014 | $7,443 | $597,000 +54.7% |
| 2012 | -- | $386,000 |
| 2011 | -- | $386,000 |
| 2010 | -- | $386,000 -12% |
| 2009 | -- | $438,400 -21.9% |
| 2008 | -- | $561,000 +2% |
| 2007 | -- | $550,000 +246.1% |
| 2006 | -- | $158,900 |
| 2005 | -- | $158,900 +4% |
| 2004 | -- | $152,732 +1.9% |
| 2003 | -- | $149,934 +2% |
| 2002 | -- | $146,995 +4% |
| 2000 | -- | $141,288 |
Find assessor info on the county website
Monthly payment
Climate risks
Neighborhood: Valley Glen

Similar homes
- $949,9003 bd2 ba1.6k sqft6056 Woodman Ave, Van Nuys, CA 91401For Sale
 MLS ID #SR26201273, John Mazziotta, Pinnacle Estate Properties. CRMLS
- $999,0003 bd2 ba1.7k sqft5906 Colbath Ave, Van Nuys, CA 91401For Sale
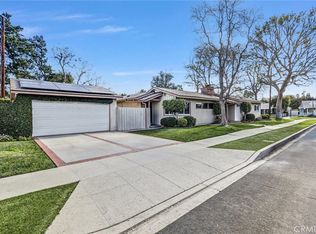 MLS ID #SR26033494, Steven Kemper, Mancuso Properties III, Inc. DBA 1 Click Real Estate. CRMLS
- $874,9503 bd2 ba1.3k sqft13601 Califa St, Van Nuys, CA 91401For Sale
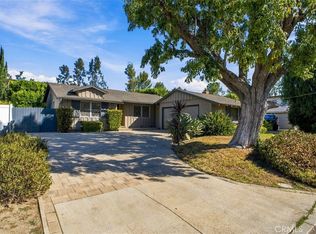 MLS ID #SR26194897, Seth Pennet, Alta Realty Group CA. CRMLS
- $999,9993 bd3 ba1.9k sqft5543 Buffalo Ave, Van Nuys, CA 91401For Sale
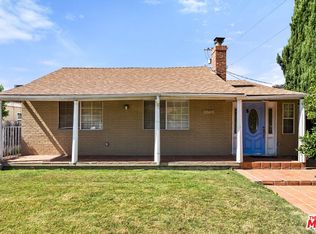 MLS ID #26996989, Kevin Goldman DRE # 02118210, Revel Real Estate. CLAW
