Spacious 3/4 bedroom, 2 bath home living room with fireplace, hardwoods, tile, young boiler, a/c, 22,500 sf lot with attached 2 car garage. Close to restaurants, school, shopping and easy access to Rts 6-114 & 195
Active
$529,900
148 Olney St, Seekonk, MA 02771
4beds
1,728sqft
Single Family Residence
Built in 1969
0.52 Acres Lot
$-- Zestimate®
$307/sqft
$-- HOA
What's special
Young boiler
- 4 days
- 718
- 51
Zillow last checked:
Listing updated:
Listed by:
Luis Mateus 401-368-2403,
Mateus Realty
Source: StateWide MLS RI,MLS#: 1428160
Facts & features
Interior
Bedrooms & bathrooms
- Bedrooms: 4
- Bathrooms: 2
- Full bathrooms: 2
Bathroom
- Features: Bath w Tub & Shower
Heating
- Oil, Baseboard, Forced Water
Cooling
- Ductless
Appliances
- Included: Tankless Water Heater
Features
- Plumbing (Copper), Plumbing (Mixed), Plumbing (PVC)
- Flooring: Ceramic Tile, Hardwood
- Windows: Insulated Windows
- Basement: Full,Interior and Exterior,Unfinished
- Number of fireplaces: 1
- Fireplace features: Brick
Interior area
- Total structure area: 1,728
- Total interior livable area: 1,728 sqft
- Finished area above ground: 1,728
- Finished area below ground: 0
Video & virtual tour
Property
Parking
- Total spaces: 8
- Parking features: Attached
- Attached garage spaces: 2
Lot
- Size: 0.52 Acres
Details
- Parcel number: SEEKM0060B0000L03270
Construction
Type & style
- Home type: SingleFamily
- Architectural style: Colonial
- Property subtype: Single Family Residence
Materials
- Vinyl Siding
- Foundation: Concrete Perimeter
Condition
- New construction: No
- Year built: 1969
Utilities & green energy
- Electric: 100 Amp Service, Circuit Breakers
- Sewer: Septic Tank
- Water: Municipal
- Utilities for property: Water Connected
Community & HOA
Community
- Features: Highway Access, Interstate, Public School, Restaurants, Schools, Near Shopping
HOA
- Has HOA: No
Location
- Region: Seekonk
Financial & listing details
- Price per square foot: $307/sqft
- Tax assessed value: $421,200
- Annual tax amount: $5,432
- Date on market: 11/9/2026
Estimated market value
Not available
Estimated sales range
Not available
Not available
Price history
| Date | Event | Price |
|---|---|---|
| 11/9/2026 | Listed for sale | $529,900$307/sqft |
Source:  StateWide MLS RI #1428160 Report a problem | ||
Public tax history
| Year | Property taxes | Tax assessment |
|---|---|---|
| 2025 | $5,202 +4.1% | $421,200 +4.1% |
| 2024 | $4,996 +3.9% | $404,500 +10.3% |
| 2023 | $4,809 +9.3% | $366,800 +11.2% |
| 2022 | $4,400 +5.1% | $329,800 +6.9% |
| 2021 | $4,188 +2.6% | $308,600 -0.5% |
| 2020 | $4,083 +3% | $310,000 +2.1% |
| 2019 | $3,965 +0.7% | $303,600 +2.9% |
| 2018 | $3,938 +4.1% | $295,000 +5% |
| 2017 | $3,782 +0.9% | $281,000 +0.6% |
| 2016 | $3,747 +8.1% | $279,400 +6.7% |
| 2015 | $3,465 +1.4% | $261,900 +2.1% |
| 2014 | $3,418 +1.3% | $256,400 -3.1% |
| 2013 | $3,375 +2.2% | $264,700 -2.3% |
| 2012 | $3,301 +3.1% | $270,800 -3.7% |
| 2011 | $3,203 +3.3% | $281,200 -4.1% |
| 2010 | $3,100 +0.7% | $293,300 -8.1% |
| 2009 | $3,077 +2.7% | $319,200 -4.3% |
| 2008 | $2,996 +8% | $333,600 +7.2% |
| 2007 | $2,775 +7.5% | $311,100 +12.8% |
| 2006 | $2,582 -1.9% | $275,900 +10.6% |
| 2005 | $2,632 +2.1% | $249,500 +35.2% |
| 2004 | $2,579 +5.3% | $184,500 |
| 2003 | $2,450 +23.1% | $184,500 +46.2% |
| 2001 | $1,991 +4.1% | $126,200 |
| 2000 | $1,913 | $126,200 |
Find assessor info on the county website
Monthly payment
Est. payment
Payment breakdown
Explore the cost of this home by adjusting the details. Changes won't be saved.Climate risks
Neighborhood: 02771

Similar homes
- $589,0003 bd2 ba1.7k sqft10 Winter Dr, Seekonk, MA 02771For Sale
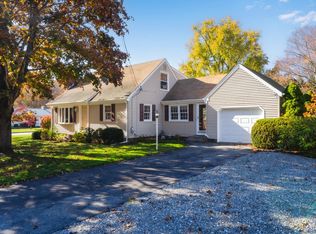 MLS ID #73600981, Joshua Santos, Remax Revolution. MLS PIN
- $420,0003 bd2 ba1.8k sqft207 Olney St, Seekonk, MA 02771For Sale
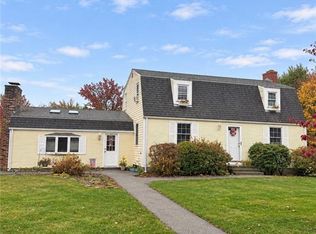
 MLS ID #1428497, Cody Sequino, Harborside Realty. StateWide MLS RI
- $500,0003 bd2 ba1.3k sqft6 Melanie Cir, Seekonk, MA 02771For Sale
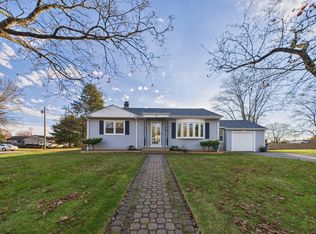 MLS ID #73602048, David Dunne, Christine Tanner. MLS PIN
- $689,0003 bd2 ba1.9k sqft190 Cole St, Seekonk, MA 02771For Sale
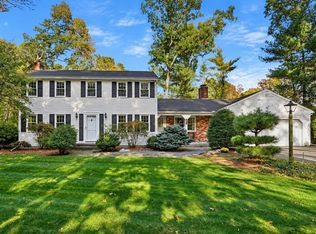 MLS ID #73600899, Susan Grieve, The Mello Group, Inc.. MLS PIN
- $539,9003 bd2 ba2.5k sqft123 Rice Ave, East Providence, RI 02914For SaleMLS ID #1428298, Mandy Roberts, Century 21 AllPoints Realty. StateWide MLS RI
- $639,0003 bd2 ba1.8k sqft36 Wildflower Dr, Seekonk, MA 02771For SaleMLS ID #1422074, Kileen Mitchell, Blu Sky Real Estate. StateWide MLS RI
- $589,0003 bd2 ba1.4k sqft14 Beaver Rd, Barrington, RI 02806For SaleMLS ID #1428334, Sonia Sharma, eXp Realty. StateWide MLS RI
- $525,0003 bd2 ba1.3k sqft39 Sachem Rd, Riverside, RI 02915For SaleMLS ID #1427456, Raisa Gonzalez, Century 21 AllPoints Realty. StateWide MLS RI
- $500,0004 bd3 ba1.6k sqft849 Roger Williams Ave, Rumford, RI 02916For SaleMLS ID #1427915, Marie Mauricio, The Mello Group, Inc.. StateWide MLS RI
