Very comfortable, easy living, 3 bedroom house. Near ODU, Downtown Norfolk, and Navy Base.
Downstairs has a living room/great room with in wall wired in surround sound speaker system, an adjoining eat in kitchen, and a half bath. Kitchen has refrigerator and electric, self cleaning range. Also has dishwasher, disposal, and built in microwave. Kitchen has sliding patio doors to a fenced in back yard.
Upstairs has a master bedroom with private full bath and two other bedrooms that share another full bathroom.. Bedrooms have plenty of closet space. There is a washer/dryer hookup in a closed off area in the upstairs hallway.
Other Features: A driveway and an enclosed garage that opens right into the house. Heating system is an all electric heat pump.
For sale by owner
$308,500
1503 W 40th St, Norfolk, VA 23508
3beds
1,500sqft
SingleFamily
Built in 2006
2,668 Square Feet Lot
$308,400 Zestimate®
$206/sqft
$-- HOA
What's special
Electric self cleaning rangeAdjoining eat in kitchenBuilt in microwave
What the owner loves about this home
Great location.
- 5 days
- 299
- 24
Listed by:
Property Owner (757) 816-8343
Facts & features
Interior
Bedrooms & bathrooms
- Bedrooms: 3
- Bathrooms: 3
- Full bathrooms: 2
- 1/2 bathrooms: 1
Heating
- Heat pump, Electric
Cooling
- Central
Appliances
- Included: Dishwasher, Garbage disposal, Microwave, Range / Oven, Refrigerator
- Laundry: Hookups
Features
- Flooring: Tile, Carpet
- Basement: None
- Has fireplace: Yes
Interior area
- Total interior livable area: 1,500 sqft
Property
Parking
- Parking features: Garage - Attached
Features
- Exterior features: Vinyl
Lot
- Size: 2,668 Square Feet
Details
- Parcel number: 11034201
Construction
Type & style
- Home type: SingleFamily
- Architectural style: Conventional
Materials
- Frame
- Roof: Asphalt
Condition
- New construction: No
- Year built: 2006
Community & HOA
Location
- Region: Norfolk
Financial & listing details
- Price per square foot: $206/sqft
- Tax assessed value: $271,900
- Annual tax amount: $3,344
- Date on market: 11/8/2026
Estimated market value
$308,400
$293,000 - $324,000
$2,267/mo
Price history
| Date | Event | Price |
|---|---|---|
| 11/8/2026 | Listed for sale | $308,500-5.1%$206/sqft |
Source: Owner Report a problem | ||
| 12/21/2023 | Listing removed | -- |
Source: Zillow Rentals Report a problem | ||
| 11/12/2023 | Price change | $1,980-10%$1/sqft |
Source: Zillow Rentals Report a problem | ||
| 10/4/2023 | Listed for rent | $2,200+31%$1/sqft |
Source: Zillow Rentals Report a problem | ||
| 10/3/2023 | Listing removed | $325,000$217/sqft |
Source:  REIN Inc. #10496897 Report a problem | ||
| 7/28/2023 | Listed for sale | $325,000+88.3%$217/sqft |
Source: REIN Inc. #10496897 Report a problem | ||
| 5/4/2021 | Listing removed | -- |
Source: Zillow Rental Network Premium Report a problem | ||
| 4/15/2021 | Listed for rent | $1,680$1/sqft |
Source: Zillow Rental Network Premium Report a problem | ||
| 3/15/2021 | Listing removed | -- |
Source: Owner Report a problem | ||
| 4/29/2019 | Listing removed | $1,680$1/sqft |
Source: Owner Report a problem | ||
| 3/29/2019 | Listed for rent | $1,680$1/sqft |
Source: Owner Report a problem | ||
| 4/5/2017 | Listing removed | $1,680$1/sqft |
Source: Owner Report a problem | ||
| 3/26/2017 | Listed for rent | $1,680$1/sqft |
Source: Owner Report a problem | ||
| 6/10/2009 | Sold | $172,571+45%$115/sqft |
Source: Public Record Report a problem | ||
| 3/23/2009 | Sold | $119,000$79/sqft |
Source: Public Record Report a problem | ||
| 2/19/2009 | Listed for sale | $119,000-31%$79/sqft |
Source: Listhub #0907262 Report a problem | ||
| 6/13/2008 | Sold | $172,571-14.8%$115/sqft |
Source: Public Record Report a problem | ||
| 2/2/2006 | Sold | $202,500$135/sqft |
Source: Public Record Report a problem | ||
Public tax history
| Year | Property taxes | Tax assessment |
|---|---|---|
| 2025 | $3,344 +1.3% | $271,900 +1.3% |
| 2024 | $3,300 +9.1% | $268,300 +10.9% |
| 2023 | $3,025 +7.4% | $242,000 +7.4% |
| 2022 | $2,816 +11% | $225,300 +11% |
| 2021 | $2,538 +8.4% | $203,000 +8.4% |
| 2020 | $2,341 | $187,300 |
| 2019 | $2,341 +6.4% | $187,300 +6.4% |
| 2018 | $2,200 +18.5% | $176,000 +4.1% |
| 2017 | $1,857 | $169,000 +3.4% |
| 2016 | $1,857 -1.2% | $163,400 |
| 2015 | $1,879 | $163,400 |
| 2014 | $1,879 | $163,400 |
| 2013 | -- | $163,400 |
| 2012 | -- | $163,400 -5.3% |
| 2011 | -- | $172,600 -0.8% |
| 2010 | -- | $174,000 +0.9% |
| 2009 | -- | $172,500 +0.8% |
| 2008 | -- | $171,200 +0.4% |
| 2007 | -- | $170,600 +16.1% |
| 2006 | -- | $146,900 +1383.8% |
| 2005 | -- | $9,900 +50% |
| 2004 | -- | $6,600 |
| 2003 | -- | $6,600 |
| 2002 | -- | $6,600 |
| 2001 | -- | $6,600 +20.7% |
| 2000 | -- | $5,470 |
Find assessor info on the county website
Monthly payment
Est. payment
Payment breakdown
Explore the cost of this home by adjusting the details. Changes won't be saved.Climate risks
Neighborhood: Lamberts Point

Similar homes
- $269,9003 bd2 ba1.2k sqft1311 W 40th St, Norfolk, VA 23508For Sale
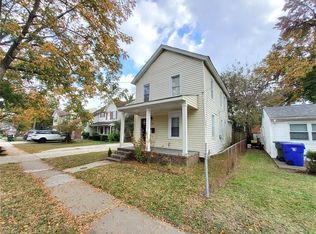 MLS ID #10661494, Faith Amoah. REIN Inc.
- $350,0004 bd2 ba1.8k sqft440 Connecticut Ave, Norfolk, VA 23508For Sale
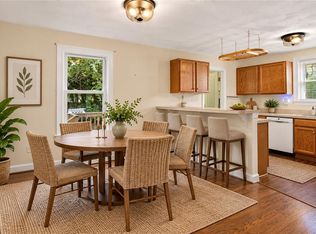 MLS ID #10661661, Angela Farber. REIN Inc.
- $323,4003 bd2 ba1.5k sqft1319 W 41st St, Norfolk, VA 23508For Sale
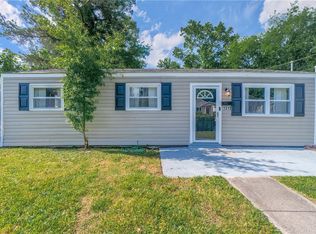 MLS ID #10654739, Cheralyn Whetstone. REIN Inc.
- $320,0004 bd2 ba1.5k sqft1417 Melrose Pkwy, Norfolk, VA 23508For Sale
 MLS ID #10650773, Thor Manousos. REIN Inc.
