This 1430 square foot single family home has 3 bedrooms and 1.0 bathrooms. This home is located at 1604 Thornton Ferry Rd, Hot Springs, AR 71913.
Foreclosed
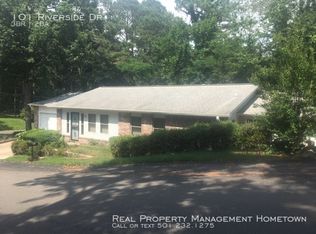
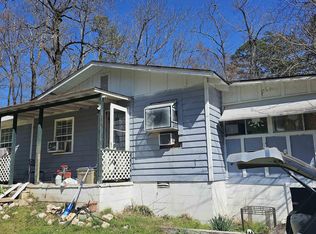
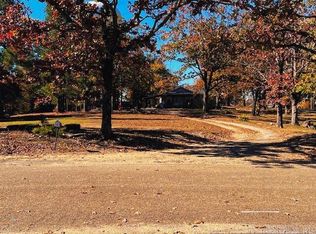
Street View
Est. $157,500
1604 Thornton Ferry Rd, Hot Springs, AR 71913
3beds
1,430sqft
SingleFamily
Built in 1950
0.28 Acres Lot
$157,500 Zestimate®
$110/sqft
$-- HOA
Overview
- 60 days |
- 53 |
- 1 |
Facts & features
Interior
Bedrooms & bathrooms
- Bedrooms: 3
- Bathrooms: 1
- Full bathrooms: 1
Heating
- None, Other
Cooling
- Central
Features
- Flooring: Hardwood, Linoleum / Vinyl
- Basement: None
- Has fireplace: No
Interior area
- Total interior livable area: 1,430 sqft
Property
Features
- Exterior features: Other
Lot
- Size: 0.28 Acres
Details
- Parcel number: 20001500031000
Construction
Type & style
- Home type: SingleFamily
Materials
- Frame
- Foundation: Piers
- Roof: Shake / Shingle
Condition
- Year built: 1950
Community & HOA
Location
- Region: Hot Springs
Financial & listing details
- Price per square foot: $110/sqft
- Tax assessed value: $106,950
- Annual tax amount: $187
Visit our professional directory to find a foreclosure specialist in your area that can help with your home search.
Find a foreclosure agentForeclosure details
Estimated market value
$157,500
$128,000 - $184,000
$1,247/mo
Price history
| Date | Event | Price |
|---|---|---|
| 4/3/2009 | Sold | $79,000+97.5%$55/sqft |
Source: Public Record Report a problem | ||
| 4/28/1995 | Sold | $40,000$28/sqft |
Source: Public Record Report a problem | ||
Public tax history
| Year | Property taxes | Tax assessment |
|---|---|---|
| 2025 | $187 -24.4% | $15,902 +4.3% |
| 2024 | $247 -13% | $15,244 +4.5% |
| 2023 | $284 -6.9% | $14,586 +4.7% |
| 2022 | $305 +10.4% | $13,928 +5.9% |
| 2021 | $276 +9.2% | $13,150 -2.4% |
| 2020 | $253 +58.4% | $13,470 |
| 2019 | $160 -1.1% | $13,470 |
| 2018 | $161 +16.8% | $13,470 |
| 2017 | $138 +20.2% | $13,470 +28% |
| 2016 | $115 | $10,520 |
| 2015 | $115 +0.9% | $10,520 |
| 2014 | $114 +54.1% | $10,520 |
| 2013 | $74 | $10,520 |
| 2012 | $74 -34.3% | $10,520 -8.4% |
| 2011 | $113 +333.9% | $11,480 +23.1% |
| 2009 | $26 | $9,329 +14.7% |
| 2008 | -- | $8,136 +4.4% |
| 2007 | $17 | $7,791 +7.6% |
| 2006 | -- | $7,240 +5% |
| 2005 | -- | $6,895 +14.3% |
| 2004 | -- | $6,035 +5% |
| 2003 | -- | $5,748 +0.1% |
| 2001 | -- | $5,744 |
Find assessor info on the county website
Monthly payment
Estimated monthly payment$1,822
All calculations are estimates and provided by Zillow, Inc. for informational purposes only. Actual amounts may vary.
HOA fees may include property taxes on listings classified as Co-Ops. Contact the listing agent and/or owner for fee details.
Mortgage interest rates are dependent on a number of factors, including credit score, down payment, and repayment length. Interest rate data provided by Zillow Group Marketplace, Inc. as of 1/1/1970 from various mortgage lenders with which we have lead or other similar arrangements; the Estimated Payment is an average of those rates.
See how much you could borrow to make a competitive offer.
Climate risks
Neighborhood: Piney
Nearby schools
GreatSchools rating
- 7/10Lake Hamilton Intermediate SchoolGrades: 4-5Distance: 4.1 mi
- 6/10Lake Hamilton Middle SchoolGrades: 6-7Distance: 4.1 mi
- 6/10Lake Hamilton High SchoolGrades: 10-12Distance: 4.4 mi


- Arkansas
- Garland County
- Hot Springs
- 71913
- Piney
- 1604 Thornton Ferry Rd
Nearby cities
Nearby neighborhoods
Nearby zip codes
Other Hot Springs Topics
