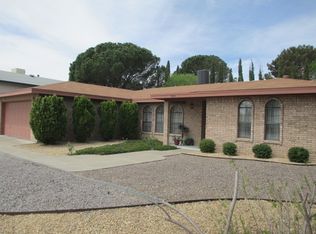
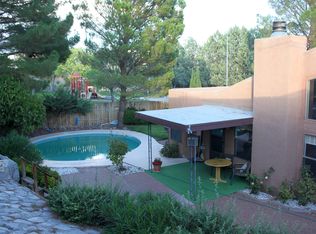
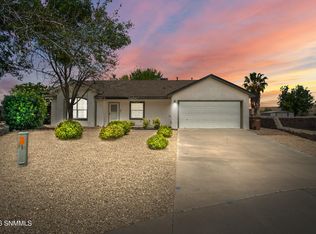
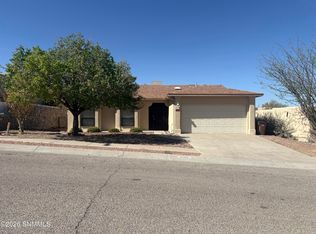
Just listed in the highly sought-after Telshor area! Conveniently located near shopping, hospitals, restaurants, and New Mexico State University, this home offers both comfort and convenience.Step inside to find an open floor plan with a spacious living room, separate dining area, and tasteful upgrades throughout. The versatile bonus room provides extra space for a home office, playroom, gym, or hobby area.Outside, the blank-slate backyard is ready for your personal touch--create the outdoor oasis you've always wanted with plenty of room to entertain, garden, or relax.Don't miss your chance to own a home in one of Las Cruces' most desirable locations. This one won't last long! With a reasonable offer seller may pay for refrigerated air to be installed.
For sale
Price increase: $34K (6/11)
$319,000
1608 Regal Rdg, Las Cruces, NM 88011
3beds
1,795sqft
:
Get pre-qualified$2,019/mo
Single Family Residence, Residential
Built in 1980
9,147 Square Feet Lot
$310,900 Zestimate®
$178/sqft
$-- HOA
What's special
Versatile bonus roomTasteful upgrades throughoutBlank-slate backyardOpen floor planSeparate dining area
- 49 days |
- 311 |
- 12 |
Zillow last checked:
Listing updated:
Listed by:
Summer Woods 575-650-0930,
Cripple Creek Realty, LLC 575-343-5980
Source: SNMMLS as distributed by MLS GRID,MLS#: 2601865
Facts & features
Interior
Bedrooms & bathrooms
- Bedrooms: 3
- Bathrooms: 2
- Full bathrooms: 2
Rooms
- Room types: Study
Primary bathroom
- Description: Shower Stall,Tile Floor
Dining room
- Features: Formal, Kitchen Combo, Tile
Kitchen
- Features: Bay Window, Gas Range, Built-in Oven/Range, Built-in Dishwasher, Tile Floor, Breakfast Bar
Living room
- Features: Fireplace, Tile
Heating
- Forced Air
Cooling
- Evaporative Cooling
Appliances
- Laundry: Mud Room
Features
- Basement: None
- Number of fireplaces: 1
Interior area
- Total structure area: 1,795
- Total interior livable area: 1,795 sqft
Property
Parking
- Total spaces: 2
- Parking features: Garage
- Garage spaces: 2
Features
- Levels: One
- Stories: 1
- Patio & porch: Covered
- Fencing: Back Yard,Rock
Lot
- Size: 9,147 Square Feet
- Dimensions: 0 to .24 AC
Details
- Parcel number: 4010135201354
Construction
Type & style
- Home type: SingleFamily
- Architectural style: Ranch
- Property subtype: Single Family Residence, Residential
Materials
- Roof: Pitched,Shingle
Condition
- New construction: No
- Year built: 1980
Utilities & green energy
- Sewer: Public Sewer
- Water: Public
- Utilities for property: El Paso Electric
Community & HOA
Community
- Subdivision: Candlelight Knolls Subd
HOA
- Has HOA: No
Location
- Region: Las Cruces
Financial & listing details
- Price per square foot: $178/sqft
- Tax assessed value: $231,661
- Annual tax amount: $2,339
- Date on market: 6/11/2026
- Electric utility on property: Yes
Estimated market value
$310,900
$295,000 - $326,000
$1,960/mo
Price history
| Date | Event | Price |
|---|---|---|
| 6/11/2026 | Price change | $319,000+11.9%$178/sqft |
Source: SNMMLS as distributed by MLS GRID #2601865 Report a problem | ||
| 5/12/2022 | Pending sale | $285,000$159/sqft |
Source: BHHS broker feed #2201362 Report a problem | ||
| 5/8/2022 | Listed for sale | $285,000$159/sqft |
Source: BHHS broker feed #2201362 Report a problem | ||
| 5/7/2022 | Pending sale | $285,000+84%$159/sqft |
Source: SNMMLS as distributed by MLS GRID #2201362 Report a problem | ||
| 1/28/2021 | Listing removed | -- |
Source: Zillow Rental Manager Report a problem | ||
| 1/9/2021 | Price change | $1,400+40%$1/sqft |
Source: Zillow Rental Manager Report a problem | ||
| 1/1/2021 | Price change | $1,000-28.6%$1/sqft |
Source: Zillow Rental Manager Report a problem | ||
| 12/17/2020 | Listed for rent | $1,400$1/sqft |
Source: Owner Report a problem | ||
| 12/28/2019 | Listing removed | $154,900$86/sqft |
Source: EXIT Realty Horizons #1902826 Report a problem | ||
| 11/9/2019 | Pending sale | $154,900$86/sqft |
Source: EXIT Realty Horizons #1902826 Report a problem | ||
| 10/30/2019 | Listed for sale | $154,900$86/sqft |
Source: EXIT Realty Horizons #1902826 Report a problem | ||
| 10/9/2019 | Pending sale | $154,900$86/sqft |
Source: EXIT Realty Horizons #1902826 Report a problem | ||
| 9/27/2019 | Listed for sale | $154,900$86/sqft |
Source: EXIT Realty Horizons #1902826 Report a problem | ||
Public tax history
| Year | Property taxes | Tax assessment |
|---|---|---|
| 2025 | $2,339 -0.6% | $77,220 |
| 2024 | $2,352 +1.4% | $77,220 +3% |
| 2023 | $2,319 +41.2% | $74,971 +43.2% |
| 2022 | $1,642 +3.4% | $52,337 +3% |
| 2021 | $1,588 +2.5% | $50,813 +3% |
| 2020 | $1,550 +19.7% | $49,333 +14.5% |
| 2019 | $1,295 -2.5% | $43,100 -2.9% |
| 2018 | $1,328 | $44,393 +3% |
| 2017 | $1,328 +12.4% | $43,100 |
| 2016 | $1,181 -1.3% | $43,100 -66.7% |
| 2015 | $1,197 -0.5% | $129,300 |
| 2014 | $1,204 +1.7% | $129,300 |
| 2013 | $1,184 0% | $129,300 |
| 2012 | $1,184 +1.5% | $129,300 |
| 2011 | $1,166 +1.8% | $129,300 0% |
| 2010 | $1,146 +9.9% | $129,320 +3% |
| 2009 | $1,042 | $125,553 +3% |
| 2008 | $1,042 +3.9% | $121,896 +3% |
| 2007 | $1,004 +4.4% | $118,347 +3% |
| 2005 | $962 +1.3% | $114,900 +3% |
| 2004 | $949 +7.1% | $111,511 |
| 2003 | $886 -2.6% | $111,511 +6.1% |
| 2002 | $909 | $105,100 |
| 2001 | $909 -0.2% | $105,100 -0.8% |
| 2000 | $912 | $105,900 |
Find assessor info on the county website
Monthly payment
Est. payment
Payment breakdown
Explore the cost of this home by adjusting the details. Changes won't be saved.Climate risks
Neighborhood: 88011
Nearby schools
GreatSchools rating
- 9/10Hillrise Elementary SchoolGrades: PK-5Distance: 0.3 mi
- 4/10Lynn Middle SchoolGrades: 6-8Distance: 1.4 mi
- 5/10Centennial High SchoolGrades: 9-12Distance: 0.9 mi
- $329,2004 bd2 ba2.1k sqft1616 Regal Rdg, Las Cruces, NM 88011Off Market
- $284,1003 bd2 ba1.5k sqft1600 Regal Rdg, Las Cruces, NM 88011Off Market
- $384,0005 bd3 ba2.6k sqft1608 Imperial Rdg, Las Cruces, NM 88011Off Market
- $334,2004 bd2 ba2.5k sqft1600 Imperial Rdg, Las Cruces, NM 88011Off Market
- $305,3003 bd2 ba2.3k sqft1624 Regal Rdg, Las Cruces, NM 88011Off Market
- $287,4003 bd2 ba1.6k sqft1530 Candlelight Dr, Las Cruces, NM 88011Off Market
- $380,3004 bd2 ba3.1k sqft1612 Imperial Rdg, Las Cruces, NM 88011Off Market
- $25,000-- bd-- ba-- sqft1505 Candlelight Dr, Las Cruces, NM 88011Off Market
A local agent can set up tours, give advice and negotiate with sellers.
A local lender can help you make sure your offer is ready when you are.
Similar homes
- $299,0003 bd2 ba2.1k sqft1714 Royal Dr, Las Cruces, NM 88011For Sale
 MLS ID #2601633, Isaiah Paul Tellez, Select Realty Group, LLC. SNMMLS as distributed by MLS GRID
 - $295,0003 bd2 ba1.5k sqft700 Scenic View Dr, Las Cruces, NM 88011For Sale
 MLS ID #2601673, Esther Oh, Prosper Real Estate. SNMMLS as distributed by MLS GRID
 - $295,0005 bd2 ba2.4k sqft3104 Missouri Ave, Las Cruces, NM 88011For Sale
 MLS ID #2601388, Arturo Escobar, Jr, Keller Williams Realty. SNMMLS as distributed by MLS GRID
 - $310,0003 bd2 ba1.8k sqft2687 Nebula Way, Las Cruces, NM 88011For Sale
 MLS ID #2600952, Elizabeth A Rivera, Rethink Real Estate, LLC. SNMMLS as distributed by MLS GRID
 - $399,0004 bd2 ba2.5k sqft1837 Fairway Cir, Las Cruces, NM 88011For SaleMLS ID #2602213, Nathaniel M May, EXIT Realty Horizons. SNMMLS as distributed by MLS GRID
- $329,5003 bd3 ba2k sqft195 Hoagland Rd, Las Cruces, NM 88005For SaleMLS ID #2602330, Palmira Pacheco, Vogue Real Estate Investments. SNMMLS as distributed by MLS GRID
- $425,0003 bd2 ba2.2k sqft3250 Majestic Rdg, Las Cruces, NM 88011For SaleMLS ID #2602041, Charles P Fowler, BHGRE Steinborn & Associates. SNMMLS as distributed by MLS GRID
- $285,0003 bd2 ba1.3k sqft2194 Frontier Dr, Las Cruces, NM 88011For SaleMLS ID #2600492, Crystal McCaslin, BHGRE Steinborn & Associates. SNMMLS as distributed by MLS GRID
- $415,0003 bd2 ba2.6k sqft700 Sundown Ct, Las Cruces, NM 88011For SaleMLS ID #2601678, Maria De La Luz Ramirez, RE/MAX Classic Realty. SNMMLS as distributed by MLS GRID
- $269,0003 bd2 ba1.7k sqft2607 Claude Dove Dr, Las Cruces, NM 88011For SaleMLS ID #2503733, Margaret Kuper Smith, EXP Realty LLC -Las Cruces. SNMMLS as distributed by MLS GRID
- $284,9003 bd2 ba1.5k sqft2038 Corn Dr, Las Cruces, NM 88001For SaleMLS ID #2602075, Daniel Gordon Buck, Distinction Realty Inc.. SNMMLS as distributed by MLS GRID
- $299,9993 bd2 ba1.7k sqft5509 Mesa Dr, Las Cruces, NM 88012For SaleMLS ID #2602150, Lance P Raney, Assist-2-sell Buyers & Sellers Realty, LLC. SNMMLS as distributed by MLS GRID
- $357,0004 bd2 ba1.9k sqft2716 Johnson St, Las Cruces, NM 88005For SaleMLS ID #2602346, Duncan Gallegos, EXIT Realty Horizons. SNMMLS as distributed by MLS GRID
- $389,0003 bd2 ba2.2k sqft2026 El Presidio, Las Cruces, NM 88011For SaleMLS ID #2602174, Irma Chavez-May, EXIT Realty Horizons. SNMMLS as distributed by MLS GRID
- $314,0004 bd2 ba1.9k sqft4926 Kailasa Dr, Las Cruces, NM 88012For SaleMLS ID #2601563, Cynthia Martin Schumacher, EXIT Realty Horizons. SNMMLS as distributed by MLS GRID
- $431,0003 bd2 ba2.2k sqft5301 Redman Rd, Las Cruces, NM 88011For SaleMLS ID #2602151, Lisa Ramos, ERA Sellers & Buyers Real Estate. SNMMLS as distributed by MLS GRID
- $305,0003 bd3 ba2.4k sqft340 Clover Dr, Las Cruces, NM 88001For SaleMLS ID #2600943, Richard Altamirano, BHGRE Steinborn & Associates. SNMMLS as distributed by MLS GRID
- $289,9003 bd2 ba1.8k sqft601 Lenox Ave, Las Cruces, NM 88005For SaleMLS ID #2601967, Tiffany Diane Kania, EXP Realty LLC -Las Cruces. SNMMLS as distributed by MLS GRID
- $222,9992 bd2 ba1.2k sqft3384 Majestic Rdg, Las Cruces, NM 88011For Sale By Owner
- $350,0004 bd3 ba2.3k sqft1448 Wofford Dr, Las Cruces, NM 88001For SaleMLS ID #2602072, Kaily Janay Spensley, United Country Salopek Realty. SNMMLS as distributed by MLS GRID
