$132,700
3 bd|1 ba|1k sqft
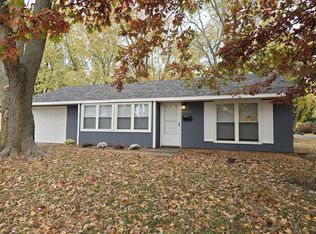
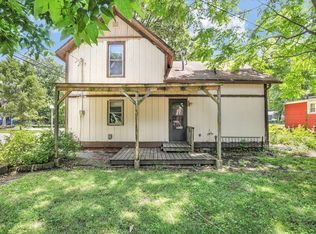
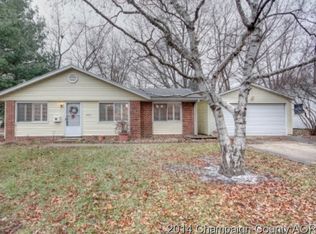
1007 Lanore Dr, Urbana, IL 61802
Off Market
Zillow last checked:
Listing updated:
Craig Buchanan 217-369-8969,
RE/MAX REALTY ASSOCIATES-CHA,
Garret Risley 217-898-7193,
RE/MAX REALTY ASSOCIATES-CHA
$136,300
$129,000 - $143,000
$1,856/mo
| Date | Event | Price |
|---|---|---|
| 5/23/2026 | Listed for sale | $139,900$88/sqft |
Source: | ||
| 5/12/2026 | Contingent | $139,900$88/sqft |
Source: | ||
| 4/20/2026 | Price change | $139,900-3.5%$88/sqft |
Source: | ||
| 3/26/2026 | Listed for sale | $144,900+11.5%$91/sqft |
Source: | ||
| 11/6/2024 | Sold | $130,000$82/sqft |
Source: Public Record Report a problem | ||
| 7/10/2023 | Sold | $130,000-3.7%$82/sqft |
Source: | ||
| 6/8/2023 | Contingent | $135,000$85/sqft |
Source: | ||
| 5/30/2023 | Listed for sale | $135,000$85/sqft |
Source: | ||
| 4/26/2023 | Contingent | $135,000$85/sqft |
Source: | ||
| 11/2/2022 | Price change | $135,000-3.6%$85/sqft |
Source: | ||
| 10/5/2022 | Price change | $140,000-6.7%$88/sqft |
Source: | ||
| 8/31/2022 | Price change | $150,000-3.2%$95/sqft |
Source: | ||
| 8/4/2022 | Price change | $155,000-2.5%$98/sqft |
Source: | ||
| 7/22/2022 | Listed for sale | $159,000+189.1%$100/sqft |
Source: | ||
| 3/24/2021 | Listing removed | -- |
Source: Owner Report a problem | ||
| 2/10/2020 | Listing removed | $950$1/sqft |
Source: Owner Report a problem | ||
| 1/17/2020 | Price change | $950-13.6%$1/sqft |
Source: Owner Report a problem | ||
| 1/7/2020 | Price change | $1,100+10.1%$1/sqft |
Source: Owner Report a problem | ||
| 11/3/2019 | Price change | $999-4.9%$1/sqft |
Source: Owner Report a problem | ||
| 10/2/2019 | Listed for rent | $1,050$1/sqft |
Source: Owner Report a problem | ||
| 11/7/2012 | Sold | $55,000$35/sqft |
Source: Public Record Report a problem | ||
| Year | Property taxes | Tax assessment |
|---|---|---|
| 2024 | $1,676 -22.4% | $22,250 +9.6% |
| 2023 | $2,159 +6.7% | $20,300 +8.6% |
| 2022 | $2,023 +7.6% | $18,690 +7.3% |
| 2021 | $1,880 +9.6% | $17,420 +9.2% |
| 2020 | $1,716 +3.4% | $15,950 |
| 2019 | $1,659 | $15,950 -0.7% |
| 2018 | $1,659 -1.2% | $16,060 +2.2% |
| 2017 | $1,680 -4.5% | $15,720 -5% |
| 2016 | $1,759 | $16,550 |
| 2015 | $1,759 -4.7% | $16,550 -5% |
| 2014 | $1,847 -3.7% | $17,420 -5% |
| 2013 | $1,918 -31.5% | $18,330 |
| 2012 | $2,800 +1.1% | $18,330 -48.9% |
| 2011 | $2,768 -1% | $35,880 -5.3% |
| 2010 | $2,795 | $37,890 -2.6% |
| 2009 | -- | $38,910 +4.2% |
| 2008 | -- | $37,350 +1.8% |
| 2007 | $2,528 -0.3% | $36,690 +2.6% |
| 2006 | $2,534 +2.9% | $35,750 +3.1% |
| 2005 | $2,463 +6.4% | $34,680 +3.2% |
| 2004 | $2,314 +4.9% | $33,610 +7.3% |
| 2003 | $2,207 +9% | $31,330 +16.9% |
| 2002 | $2,024 +3.4% | $26,810 +3.1% |
| 2001 | $1,958 +5.6% | $26,010 +4.7% |
| 2000 | $1,855 | $24,850 |
Find assessor info on the county website
Source: MRED as distributed by MLS GRID. This data may not be complete. We recommend contacting the local school district to confirm school assignments for this home.
A local agent can set up tours, give advice and negotiate with sellers.
A local lender can help you make sure your offer is ready when you are.