This 2539 square foot single family home has 4 bedrooms and 2.0 bathrooms. This home is located at 1617 SW 18th Ln, Cape Coral, FL 33991.
Pre-foreclosure
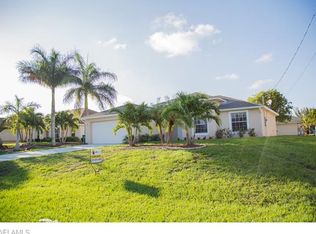
Street View
Est. $357,800
1617 SW 18th Ln, Cape Coral, FL 33991
4beds
2baths
2,539sqft
SingleFamily
Built in 2004
10,018 Square Feet Lot
$357,800 Zestimate®
$141/sqft
$-- HOA
Overview
- 47 days |
- 23 |
- 1 |
Facts & features
Interior
Bedrooms & bathrooms
- Bedrooms: 4
- Bathrooms: 2
Heating
- Forced air
Cooling
- Central
Features
- Flooring: Other, Carpet
Interior area
- Total interior livable area: 2,539 sqft
Property
Parking
- Parking features: Garage - Attached
Features
- Exterior features: Stucco
Lot
- Size: 10,018 Square Feet
Details
- Parcel number: 284423C2048160260
Construction
Type & style
- Home type: SingleFamily
Materials
- Roof: Asphalt
Condition
- Year built: 2004
Community & HOA
Location
- Region: Cape Coral
Financial & listing details
- Price per square foot: $141/sqft
- Tax assessed value: $334,053
- Annual tax amount: $6,914
Visit our professional directory to find a foreclosure specialist in your area that can help with your home search.
Find a foreclosure agentForeclosure details
Estimated market value
$357,800
$333,000 - $383,000
$3,516/mo
Price history
| Date | Event | Price |
|---|---|---|
| 1/10/2005 | Sold | $235,000+27.6%$93/sqft |
Source: Public Record Report a problem | ||
| 9/13/2004 | Sold | $184,200+1501.7%$73/sqft |
Source: Public Record Report a problem | ||
| 8/1/2003 | Sold | $11,500$5/sqft |
Source: Public Record Report a problem | ||
Public tax history
| Year | Property taxes | Tax assessment |
|---|---|---|
| 2025 | $6,914 +10.2% | $324,825 +10% |
| 2024 | $6,276 -7.2% | $295,295 -9.3% |
| 2023 | $6,762 +354.7% | $325,491 |
| 2022 | $1,487 +6.4% | -- |
| 2021 | $1,397 +2.4% | -- |
| 2020 | $1,365 -48% | -- |
| 2019 | $2,626 | $215,595 +73.5% |
| 2018 | $2,626 +1.7% | $124,240 +2.1% |
| 2017 | $2,583 +1.2% | $121,685 -35.7% |
| 2016 | $2,551 +1.6% | $189,201 +23.6% |
| 2015 | $2,511 -1.1% | $153,108 -1.5% |
| 2014 | $2,540 +4.6% | $155,391 +20% |
| 2013 | $2,427 +944.9% | $129,485 +2.9% |
| 2012 | $232 -1.4% | $125,804 +13.9% |
| 2011 | $236 -3.1% | $110,433 -1.5% |
| 2010 | $243 -8.3% | $112,110 -19.6% |
| 2009 | $265 -2.1% | $139,520 -51.2% |
| 2007 | $271 -1.1% | $285,870 +1.1% |
| 2006 | $274 -20.5% | $282,770 +1919.8% |
| 2004 | $344 +130.5% | $14,000 +173.4% |
| 2003 | $149 +36% | $5,120 +50.6% |
| 2002 | $110 | $3,400 +17.2% |
| 2000 | -- | $2,900 |
Find assessor info on the county website
Monthly payment
Estimated monthly payment$1,822
All calculations are estimates and provided by Zillow, Inc. for informational purposes only. Actual amounts may vary.
HOA fees may include property taxes on listings classified as Co-Ops. Contact the listing agent and/or owner for fee details.
Mortgage interest rates are dependent on a number of factors, including credit score, down payment, and repayment length. Interest rate data provided by Zillow Group Marketplace, Inc. as of 1/1/1970 from various mortgage lenders with which we have lead or other similar arrangements; the Estimated Payment is an average of those rates.
See how much you could borrow to make a competitive offer.
Climate risks
Neighborhood: 33991
Nearby schools
GreatSchools rating
- 6/10Trafalgar Elementary SchoolGrades: PK-5Distance: 0.5 mi
- 6/10Trafalgar Middle SchoolGrades: 6-8Distance: 0.5 mi
- 5/10Cape Coral High SchoolGrades: 9-12Distance: 2 mi


- Florida
- Lee County
- Cape Coral
- 33991
- 1617 SW 18th Ln
Nearby cities
Nearby neighborhoods
Nearby zip codes
Other Cape Coral Topics
