This 3760 square foot multi family home has 9 bedrooms and 5.0 bathrooms. This home is located at 17705 Exchange Ave, Lansing, IL 60438.
Foreclosed
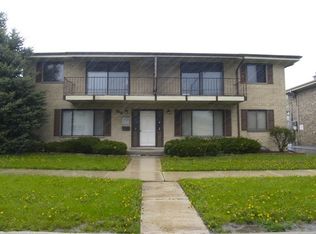
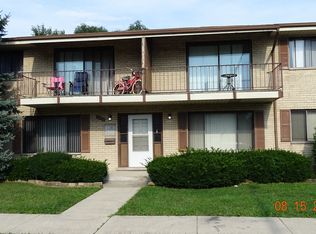
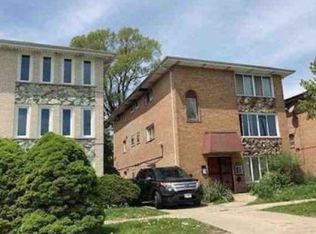
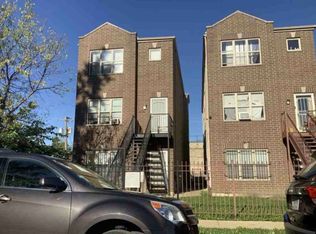
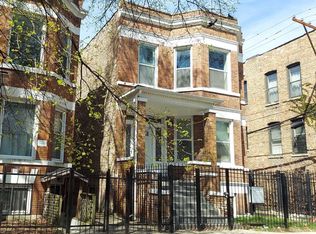
Street View
Est. $555,100
17705 Exchange Ave, Lansing, IL 60438
9beds
5baths
3,760sqft
MultiFamily
Built in 1974
-- sqft lot
$555,100 Zestimate®
$148/sqft
$-- HOA
Overview
- 57 days |
- 12 |
- 1 |
Facts & features
Interior
Bedrooms & bathrooms
- Bedrooms: 9
- Bathrooms: 5
Heating
- Forced air
Cooling
- Central
Features
- Basement: Partially finished
Interior area
- Total interior livable area: 3,760 sqft
Property
Features
- Exterior features: Stone
Lot
- Size: 7,402 Square Feet
Details
- Parcel number: 3030313050
Construction
Type & style
- Home type: MultiFamily
Materials
- Roof: Shake / Shingle
Condition
- Year built: 1974
Community & HOA
Location
- Region: Lansing
Financial & listing details
- Price per square foot: $148/sqft
- Tax assessed value: $300,000
Visit our professional directory to find a foreclosure specialist in your area that can help with your home search.
Find a foreclosure agentForeclosure details
Estimated market value
$555,100
$488,000 - $616,000
$1,553/mo
Price history
| Date | Event | Price |
|---|---|---|
| 5/8/2026 | Sold | $786,296$209/sqft |
Source: Public Record Report a problem | ||
Public tax history
| Year | Property taxes | Tax assessment |
|---|---|---|
| 2024 | -- | $30,000 +0% |
| 2023 | $14,515 +36.5% | $29,999 +83.3% |
| 2022 | $10,635 +2.8% | $16,364 |
| 2021 | $10,345 +7.7% | $16,364 |
| 2020 | $9,601 -32.6% | $16,364 -34.6% |
| 2019 | $14,237 +1.9% | $25,008 |
| 2018 | $13,974 -1% | $25,008 |
| 2017 | $14,110 +57.8% | $25,008 +21.2% |
| 2016 | $8,941 -14.7% | $20,632 |
| 2015 | $10,482 +82.1% | $20,632 |
| 2014 | $5,755 +8.7% | $20,632 -7.3% |
| 2013 | $5,295 +13.4% | $22,258 |
| 2012 | $4,670 +6.5% | $22,258 -4.2% |
| 2011 | $4,387 +13.8% | $23,231 -7.3% |
| 2010 | $3,854 +4.6% | $25,052 |
| 2009 | $3,684 +1.5% | $25,052 -5% |
| 2008 | $3,631 -7.7% | $26,370 -4% |
| 2007 | $3,933 +0.6% | $27,465 |
| 2006 | $3,911 +1.2% | $27,465 |
| 2005 | $3,864 -6.3% | $27,465 +19.6% |
| 2004 | $4,125 +0.2% | $22,972 |
| 2003 | $4,117 +18.4% | $22,972 |
| 2002 | $3,476 -9.6% | $22,972 +5.9% |
| 2001 | $3,844 +2.5% | $21,698 |
| 2000 | $3,749 -4.9% | $21,698 |
| 1999 | $3,943 | $21,698 |
Find assessor info on the county website
Monthly payment
Estimated monthly payment$1,822
All calculations are estimates and provided by Zillow, Inc. for informational purposes only. Actual amounts may vary.
HOA fees may include property taxes on listings classified as Co-Ops. Contact the listing agent and/or owner for fee details.
Mortgage interest rates are dependent on a number of factors, including credit score, down payment, and repayment length. Interest rate data provided by Zillow Group Marketplace, Inc. as of 1/1/1970 from various mortgage lenders with which we have lead or other similar arrangements; the Estimated Payment is an average of those rates.
See how much you could borrow to make a competitive offer.
Climate risks
Neighborhood: 60438
Nearby schools
GreatSchools rating
- NALester Crawl Primary CenterGrades: PK-1Distance: 0.9 mi
- 4/10Memorial Jr High SchoolGrades: 6-8Distance: 0.7 mi
- 7/10Thornton Fractional South High SchoolGrades: 9-12Distance: 1.1 mi


- Illinois
- Cook County
- Lansing
- 60438
- 17705 Exchange Ave
Nearby cities
Nearby zip codes
Other Lansing Topics
