Looking for an affordable way into homeownership in Johnson City? This charming 3 bedroom, 1 bath home is priced to move at just $169,800! Enjoy comfortable living spaces, a functional kitchen, and a convenient location close to shopping, dining, and everything Johnson City has to offer. Whether you're a first-time buyer, downsizing, or looking for a smart investment, this one checks the boxes without breaking the bank. Homes at this price don't last long, so schedule your showing today! Buyer(s) to verify any and all information contained herein. Subject to errors and omissions.
For sale
$169,800
1817 E Millard St, Johnson City, TN 37601
3beds
980sqft
Single Family Residence, Residential
Built in 1960
6,969 Square Feet Lot
$166,500 Zestimate®
$173/sqft
$-- HOA
What's special
Functional kitchenComfortable living spaces
- 7 hours
- 110
- 10
Zillow last checked:
Listing updated:
Listed by:
Andrew Marshall 443-643-5804,
Greater Impact Realty Jonesborough 423-973-8634
Source: TVRMLS,MLS#: 10003392
Facts & features
Interior
Bedrooms & bathrooms
- Bedrooms: 3
- Bathrooms: 1
- Full bathrooms: 1
Primary bedroom
- Level: First
Bedroom 2
- Level: First
Bedroom 3
- Level: First
Bathroom 1
- Level: First
Dining room
- Level: First
Kitchen
- Level: First
Laundry
- Level: First
Living room
- Level: First
Heating
- Central
Cooling
- Central Air
Interior area
- Total structure area: 980
- Total interior livable area: 980 sqft
Property
Lot
- Size: 6,969 Square Feet
- Dimensions: 7,000 SF appro x
- Topography: Level
Details
- Parcel number: 039p F 002.00
- Zoning: Res
Construction
Type & style
- Home type: SingleFamily
- Architectural style: Ranch
- Property subtype: Single Family Residence, Residential
Materials
- Vinyl Siding
- Roof: Shingle
Condition
- Average
- New construction: No
- Year built: 1960
Utilities & green energy
- Water: Public
Community & HOA
Community
- Subdivision: Not In Subdivision
HOA
- Has HOA: No
Location
- Region: Johnson City
Financial & listing details
- Price per square foot: $173/sqft
- Tax assessed value: $141,200
- Annual tax amount: $1,090
- Date on market: 11/17/2026
- Listing terms: Cash,Conventional,FHA,VA Loan
Estimated market value
$166,500
$152,000 - $180,000
$1,601/mo
Price history
| Date | Event | Price |
|---|---|---|
| 11/18/2026 | Listed for sale | $169,800+25.8%$173/sqft |
Source: TVRMLS #10003392 Report a problem | ||
| 7/27/2022 | Sold | $135,000-6.8%$138/sqft |
Source: TVRMLS #9939238 Report a problem | ||
| 7/9/2022 | Contingent | $144,900$148/sqft |
Source: TVRMLS #9939238 Report a problem | ||
| 7/1/2022 | Price change | $144,900-3.3%$148/sqft |
Source: TVRMLS #9939238 Report a problem | ||
| 6/28/2022 | Listed for sale | $149,900$153/sqft |
Source: TVRMLS #9939238 Report a problem | ||
| 6/20/2022 | Contingent | $149,900$153/sqft |
Source: TVRMLS #9939238 Report a problem | ||
| 6/17/2022 | Listed for sale | $149,900$153/sqft |
Source: TVRMLS #9939238 Report a problem | ||
| 6/16/2022 | Contingent | $149,900$153/sqft |
Source: TVRMLS #9939238 Report a problem | ||
| 6/14/2022 | Listed for sale | $149,900+130.6%$153/sqft |
Source: TVRMLS #9939238 Report a problem | ||
| 1/4/2022 | Sold | $65,000$66/sqft |
Source: Public Record Report a problem | ||
Public tax history
| Year | Property taxes | Tax assessment |
|---|---|---|
| 2025 | $1,090 +0.8% | $35,300 |
| 2024 | $1,082 +43.5% | $35,300 +93.4% |
| 2023 | $754 +23.9% | $18,250 +16.4% |
| 2022 | $608 +0.6% | $15,675 +0.6% |
| 2021 | $604 +0.5% | $15,575 |
| 2020 | $601 +79.5% | $15,575 |
| 2019 | $335 | $15,575 +15.6% |
| 2018 | -- | $13,475 |
| 2017 | $576 | $13,475 |
| 2016 | $576 +11% | $13,475 |
| 2015 | $519 +6.9% | $13,475 |
| 2014 | $485 | $13,475 |
| 2013 | -- | $13,475 -3.9% |
| 2011 | $489 +0.9% | $14,025 |
| 2010 | $484 | $14,025 |
| 2009 | $484 | $14,025 |
| 2008 | -- | $14,025 +25.2% |
| 2007 | $479 +8.9% | $11,200 |
| 2006 | $440 +3.4% | $11,200 |
| 2005 | $426 | $11,200 |
| 2004 | $426 +18.2% | $11,200 +26.9% |
| 2003 | $360 | $8,825 +0.1% |
| 2001 | -- | $8,814 -75% |
| 2000 | -- | $35,257 |
Find assessor info on the county website
Monthly payment
Est. payment
Payment breakdown
Explore the cost of this home by adjusting the details. Changes won't be saved.Climate risks
Neighborhood: 37601
Nearby schools
Schools provided by the listing agent
- Elementary: North Side
- Middle: Liberty Bell
- High: Science Hill
Source: TVRMLS. This data may not be complete. We recommend contacting the local school district to confirm school assignments for this home.
- $30,000-- bd0 ba1.8k sqft1815 E Millard St, Johnson City, TN 37601Sold
- $134,000-- bd0 ba708 sqft1813 E Millard St #1811, Johnson City, TN 37601Off Market
- $107,900-- bd0 ba1.6k sqft1901 E Millard St, Johnson City, TN 37601Off Market
- $180,9004 bd2 ba2.3k sqft1816 E Fairview Ave, Johnson City, TN 37601Off Market
Similar homes
- $159,5003 bd1 ba925 sqft308 Colorado St, Johnson City, TN 37601For Sale
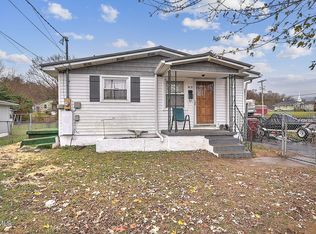 MLS ID #10003377, Colin Johnson. TVRMLS
- $249,0003 bd2 ba1k sqft1712 E Unaka Ave, Johnson City, TN 37601For Sale
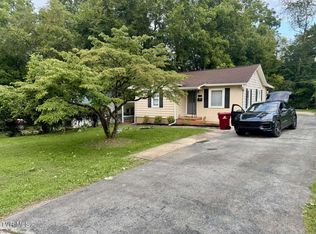 MLS ID #10003330, Darrell Lewis. TVRMLS
- $199,9002 bd1 ba1k sqft1201 Meadowview Ave, Johnson City, TN 37601For Sale
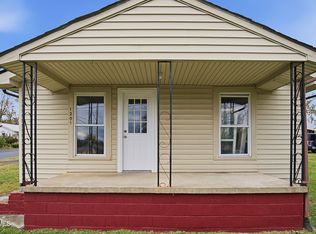 MLS ID #10003307, Scott Albright. TVRMLS
- $209,5002 bd1 ba1.2k sqft1510 E Chilhowie Ave, Johnson City, TN 37601For Sale
 MLS ID #10003315, Jacob Rogers. TVRMLS
