Fully rented triplex within walking distance to St. Vincent and Midtown Shopping Center, hardwood floors, washer dryer hookup, off street parking.
Active under contract
Price cut: $24K (9/18)
$235,000
201 N Fillmore St, Little Rock, AR 72205
--beds
--baths
2,184sqft
Triplex
Built in 1958
-- sqft lot
$-- Zestimate®
$108/sqft
$-- HOA
What's special
- 382 days
- 144
- 15
Zillow last checked:
Listing updated:
Listed by:
Steven Hendrich 501-801-5868,
The H Group Real Estate & Property Management, LLC 501-801-5868
Source: CARMLS,MLS#: 25041540
Facts & features
Interior
Appliances
- Included: Free-Standing Range, Dishwasher, Refrigerator, Gas Water Heater
- Laundry: Washer Hookup, Gas Dryer Hookup
Features
- Sheet Rock
- Flooring: Vinyl, Wood
Interior area
- Total structure area: 2,184
- Total interior livable area: 2,184 sqft
Property
Parking
- Total spaces: 2
- Parking features: Two Car
Features
- Levels: One
Lot
- Size: 7,840 Square Feet
- Dimensions: 157 x 49
- Features: Level
Details
- Parcel number: 34L1070001500
- Zoning: Residentia
Construction
Type & style
- Home type: MultiFamily
- Architectural style: Traditional
- Property subtype: Triplex
Materials
- Brick
- Foundation: Crawl Space
- Roof: Composition
Condition
- New construction: No
- Year built: 1958
Utilities & green energy
- Electric: Electric-Municipal
- Gas: Gas-Natural
- Sewer: Public Sewer
- Utilities for property: Natural Gas Connected
Community & HOA
Community
- Subdivision: Strong & Waters
Location
- Region: Little Rock
Financial & listing details
- Price per square foot: $108/sqft
- Tax assessed value: $263,765
- Annual tax amount: $3,145
- Date on market: 10/16/2025
- Listing terms: Conventional
- Lease term: 12 Months
- Tenant pays: All Utilities, Gas, Electricity, Water, Sewer, Cable TV
- Road surface type: Paved
Estimated market value
Not available
Estimated sales range
Not available
$1,887/mo
Price history
| Date | Event | Price |
|---|---|---|
| 10/19/2026 | Contingent | $235,000$108/sqft |
Source:  CARMLS #25041540 Report a problem | ||
| 9/18/2026 | Price change | $235,000-9.3%$108/sqft |
Source: CARMLS #25041540 Report a problem | ||
| 7/17/2026 | Listed for sale | $259,000$119/sqft |
Source: CARMLS #25041540 Report a problem | ||
| 7/7/2026 | Contingent | $259,000$119/sqft |
Source: CARMLS #26026566 Report a problem | ||
| 7/1/2026 | Listed for sale | $259,000$119/sqft |
Source: CARMLS #26026566 Report a problem | ||
| 7/1/2026 | Listing removed | $259,000-9.1%$119/sqft |
Source: CARMLS #25041540 Report a problem | ||
| 2/27/2026 | Listing removed | $285,000$130/sqft |
Source: CARMLS #25041540 Report a problem | ||
| 2/20/2026 | Price change | $285,000-3.4%$130/sqft |
Source: CARMLS #25041540 Report a problem | ||
| 10/16/2025 | Listed for sale | $295,000$135/sqft |
Source: CARMLS #25041540 Report a problem | ||
| 7/14/2025 | Listing removed | $295,000$135/sqft |
Source: CARMLS #25003010 Report a problem | ||
| 5/27/2025 | Contingent | $295,000$135/sqft |
Source: CARMLS #25003010 Report a problem | ||
| 5/2/2025 | Price change | $295,000-6.3%$135/sqft |
Source: CARMLS #25003010 Report a problem | ||
| 1/24/2025 | Listed for sale | $315,000+270.6%$144/sqft |
Source: CARMLS #25003010 Report a problem | ||
| 3/2/2005 | Sold | $85,000$39/sqft |
Source: Public Record Report a problem | ||
Public tax history
| Year | Property taxes | Tax assessment |
|---|---|---|
| 2025 | $3,388 +7.7% | $48,400 +7.7% |
| 2024 | $3,146 +8.3% | $44,940 +8.3% |
| 2023 | $2,904 +9.1% | $41,480 +9.1% |
| 2022 | $2,661 +9.2% | $38,020 +10% |
| 2021 | $2,436 +0.7% | $34,560 |
| 2020 | $2,419 +2.6% | $34,560 |
| 2019 | $2,359 +8.3% | $34,560 |
| 2018 | $2,178 +9.1% | $34,560 |
| 2017 | $1,996 | $34,560 -1.4% |
| 2016 | $1,996 +17.7% | $35,060 +44.9% |
| 2015 | $1,696 +16.7% | $24,200 +16.7% |
| 2014 | $1,454 +9.1% | $20,740 +9.1% |
| 2013 | $1,333 | $19,010 -51.4% |
| 2012 | -- | $39,130 +126.4% |
| 2011 | -- | $17,280 |
| 2010 | -- | $17,280 -10.1% |
| 2009 | -- | $19,219 -2.2% |
| 2008 | -- | $19,650 |
| 2007 | -- | $19,650 +4.8% |
| 2005 | -- | $18,750 |
| 2004 | -- | $18,750 +57% |
| 2003 | -- | $11,942 |
| 2002 | -- | $11,942 |
| 2001 | -- | $11,942 |
Find assessor info on the county website
Monthly payment
Est. payment
Payment breakdown
Explore the cost of this home by adjusting the details. Changes won't be saved.Climate risks
Neighborhood: Hillcrest


Similar homes
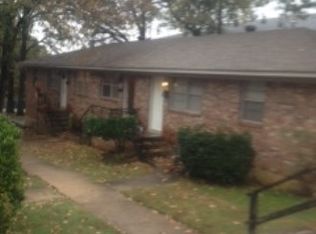
- $214,5004 bd2 ba1.5k sqft2105 & 2107 Durwood Rd, Little Rock, AR 72207For Sale
 MLS ID #26043773, Cece McKay, Crye-Leike REALTORS Kanis Branch. CARMLS
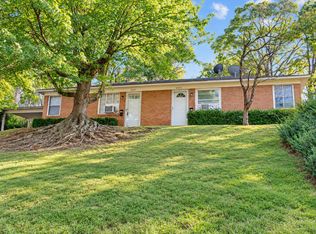
- $229,990-- bd-- ba1.5k sqft128 S Woodrow St, Little Rock, AR 72205For Sale
 MLS ID #26042385, Troy Shelton, Simpli HOM. CARMLS
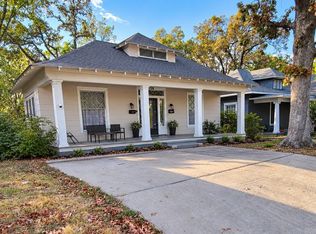
- $223,8993 bd2 ba1.7k sqft823 Bryan St, Little Rock, AR 72205For Sale
 MLS ID #26003722, Robbie Sherman, Real Property Management Central AR. CARMLS
- $225,0003 bd1 ba1.3k sqft4819 Lee Ave, Little Rock, AR 72205For Sale
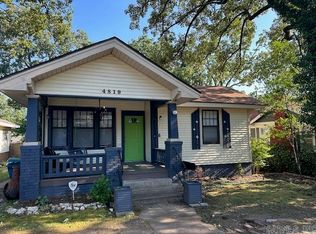 MLS ID #26005021, Cynthia A Gildner, Trademark Real Estate, Inc.. CARMLS
- $199,0004 bd3 ba2.8k sqft1524 S Tyler St, Little Rock, AR 72204For SaleMLS ID #26042043, Samuel E Smith, Level Up Realty. CARMLS
- $209,0003 bd2 ba1.5k sqft10012 Ronald Dr, Little Rock, AR 72205For SaleMLS ID #26015448, Charlie Clifton Jr., Home Design and Realty L.L.C.. CARMLS
- $183,5004 bd2 ba1.5k sqft7400 Briarwood Dr, Little Rock, AR 72205For SaleMLS ID #26010516, Marilyn Lee, CBRPM Maumelle. CARMLS
- $194,9004 bd2 ba1.4k sqft3615 W Capitol Ave, Little Rock, AR 72205For SaleMLS ID #26029879, Robbie Sherman, Real Property Management Central AR. CARMLS
- $264,9004 bd3 ba2.2k sqft23 Crownpoint Rd, Little Rock, AR 72227For SaleMLS ID #26038345, Spencer Manus, McGraw Realtors - Little Rock. CARMLS
- $225,0003 bd2 ba1.4k sqft7404 Indiana Ave, Little Rock, AR 72207For SaleMLS ID #26027082, Nola Ford, Crye-Leike REALTORS Maumelle. CARMLS
- $125,0003 bd2 ba1.7k sqft1401 S Jackson St, Little Rock, AR 72204For SaleMLS ID #26043620, Angela Allen-Eggers, Crye-Leike Realtors Financial Centre Branch. CARMLS
- $298,0004 bd4 ba2k sqft2219-2221 Blackwood Rd, Little Rock, AR 72207For SaleMLS ID #25039151, Chase R Calhoun, Chase Calhoun Real Estate LLC. CARMLS
- $248,0002 bd1 ba1.1k sqft6317 Kenwood Rd, Cammack Village, AR 72207For SaleMLS ID #26042188, Griffyn E Gentry, IRealty Arkansas - LR. CARMLS
- $184,0002 bd1 ba1.3k sqft816 N Monroe St, Little Rock, AR 72205For SaleMLS ID #26027005, Amber L Wood, Mid South Realty. CARMLS
- $129,9004 bd2 ba1.3k sqft4905 Mabelvale Pike, Little Rock, AR 72209For SaleMLS ID #26043949, Whitney Hicks, Compass Group Real Estate. CARMLS
- $259,0004 bd3 ba2.5k sqft12301 Pleasant Forest Dr, Little Rock, AR 72212For SaleMLS ID #26031719, Tim A Clark, CENTURY 21 Real Estate Unlimited. CARMLS
- $211,0003 bd2 ba1.6k sqft719 W 17th St, Little Rock, AR 72206For SaleMLS ID #26031377, Annette Hurley, LPT Realty. CARMLS
- $179,900-- bd-- ba2.5k sqft4815-4821 School St, North Little Rock, AR 72117For SaleMLS ID #26043953, Whitney Hicks, Compass Group Real Estate. CARMLS
- $135,0004 bd2 ba2.5k sqft3709 W 12th St, Little Rock, AR 72204For SaleMLS ID #25040969, Rocky Herman, Access Realty, Inc.. CARMLS
- $160,0004 bd2 ba1.5k sqft2002 S Tyler St, Little Rock, AR 72204For SaleMLS ID #26041987, Paige Paul, Home Design and Realty L.L.C.. CARMLS
