Spacious newly renovated home in the hills of Vallejo. Established neighborhood Tastefully updated throughout with brand new kitchen and baths. 4 bedrooms and 3 fulls baths (one bedroom and bath downstairs) Backyard perfect for entertaining W/ views. 3 car garage..This place has it all! Take a look today! Act Quick! This one won't last long!
Pre-foreclosure
Street View
Est. $673,000
2119 Garnet Cir, Vallejo, CA 94591
4beds
3baths
2,246sqft
SingleFamily
Built in 1998
5,601 Square Feet Lot
$673,000 Zestimate®
$300/sqft
$-- HOA
Overview
- 45 days
- 10
- 0
Facts & features
Interior
Bedrooms & bathrooms
- Bedrooms: 4
- Bathrooms: 3
Heating
- Other
Cooling
- Central
Features
- Has fireplace: Yes
Interior area
- Total interior livable area: 2,246 sqft
Property
Parking
- Parking features: Garage - Attached
Lot
- Size: 5,601 Square Feet
Details
- Parcel number: 0081604370
Construction
Type & style
- Home type: SingleFamily
Condition
- Year built: 1998
Community & HOA
Location
- Region: Vallejo
Financial & listing details
- Price per square foot: $300/sqft
- Tax assessed value: $527,120
Foreclosure details
Estimated market value
$673,000
$639,000 - $707,000
$3,894/mo
Price history
| Date | Event | Price |
|---|---|---|
| 12/19/2014 | Sold | $430,000+2.6%$191/sqft |
Source: Public Record Report a problem | ||
| 10/9/2014 | Listed for sale | $419,000+25.1%$187/sqft |
Source: New Strategy Real Estate #21423316 Report a problem | ||
| 8/22/2014 | Sold | $335,000+48.9%$149/sqft |
Source: Public Record Report a problem | ||
| 3/6/2007 | Sold | $225,000$100/sqft |
Source: Public Record Report a problem | ||
| 1/21/1998 | Sold | $225,000$100/sqft |
Source: Public Record Report a problem | ||
Public tax history
| Year | Property taxes | Tax assessment |
|---|---|---|
| 2026 | -- | $527,120 +2% |
| 2025 | $8,982 +5.2% | $516,785 +2% |
| 2024 | $8,534 +5% | $506,653 +2% |
| 2023 | $8,131 +6.6% | $496,720 +2% |
| 2022 | $7,630 +1.9% | $486,981 +2% |
| 2021 | $7,491 -0.7% | $477,433 +1% |
| 2020 | $7,542 +2.3% | $472,539 +2% |
| 2019 | $7,374 +5.4% | $463,275 +2% |
| 2018 | $6,998 +3.6% | $454,192 +2% |
| 2017 | $6,756 +9.2% | $445,287 +2% |
| 2016 | $6,189 +1.1% | $436,557 +1.5% |
| 2015 | $6,122 +4.4% | $430,000 +46% |
| 2014 | $5,866 | $294,514 +0.5% |
| 2013 | -- | $293,183 +14.5% |
| 2012 | -- | $256,000 -9.2% |
| 2011 | -- | $281,798 +0.8% |
| 2010 | -- | $279,692 -0.2% |
| 2009 | -- | $280,356 +2% |
| 2008 | -- | $274,859 +2% |
| 2007 | -- | $269,470 +2% |
| 2006 | -- | $264,186 +2% |
| 2005 | -- | $259,006 +2% |
| 2004 | -- | $253,927 +1.9% |
| 2003 | -- | $249,273 +2% |
| 2002 | -- | $244,385 +2% |
| 2001 | -- | $239,593 +2% |
| 2000 | $3,886 | $234,895 |
Find assessor info on the county website
Monthly payment
Climate risks
Neighborhood: Hunter Ranch

Similar homes
- $699,0004 bd3 ba2.2k sqft3411 EDGEWATER Place, Vallejo, CA 94591For Sale
 MLS ID #326091829, Tim Garton, Messina Realty Inc. BAREIS
- $750,0004 bd3 ba2k sqft185 Wren Court, Vallejo, CA 94591For SaleMLS ID #326094222, Ulysses Dinglasan, Coldwell Banker Solano Pacific. BAREIS
- $639,0004 bd3 ba1.8k sqft450 Masonic Court, Vallejo, CA 94591For Sale
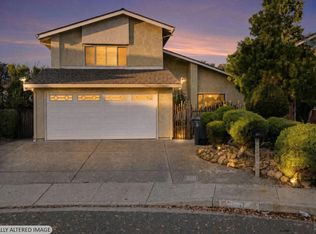 MLS ID #326085830, Jeremy M Daum, Daum Realty Inc. BAREIS
- $753,0004 bd3 ba2.7k sqft3420 Edgewater Place, Vallejo, CA 94591For Sale
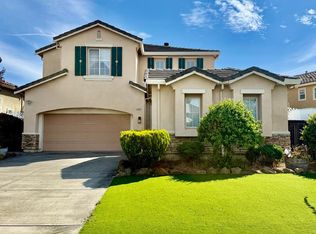 MLS ID #326077144, Elvira DeGuzman, Cornerstone Real Estate Invest. BAREIS
