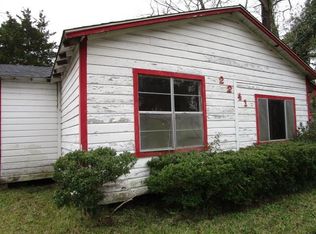
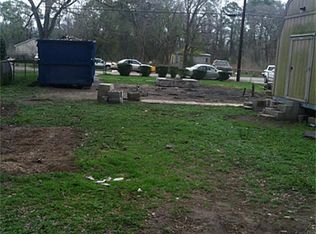
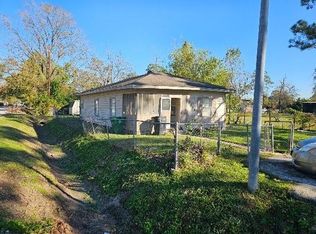
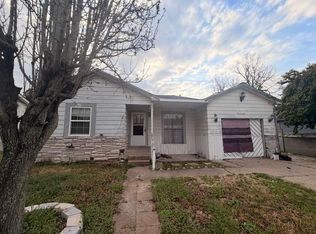
Ideal for developers, this property presents a fantastic opportunity with a repairable home and the potential to develop 2 to 4 units. Take advantage of the area’s ongoing growth and unlock its full potential. Don’t let this incredible chance pass you by!
For sale
$140,000
2237 Wilburforce St, Houston, TX 77091
3beds
1,296sqft
Other
Built in 1949
5,375 Square Feet Lot
$77,800 Zestimate®
$108/sqft
$-- HOA
What's special
- 520 days |
- 102 |
- 4 |
Zillow last checked:
Listed by:
Deon Clewis,
EXIT REALTY 360
Source: EXIT Realty broker feed,MLS#: 50678128
Loading...
Facts & features
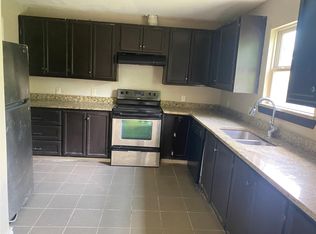
Interior
Bedrooms & bathrooms
- Bedrooms: 3
- Bathrooms: 2
- Full bathrooms: 2
Heating
- Natural Gas
Cooling
- Other
Features
- Basement:
- Has fireplace: No
Interior area
- Total structure area: 1,296
- Total interior livable area: 1,296 sqft
Video & virtual tour
Property
Lot
- Size: 5,375 Square Feet
Details
- Parcel number: 0814320000025
Construction
Type & style
- Home type: SingleFamily
- Property subtype: Other
Condition
- Year built: 1949
Community & HOA
Location
- Region: Houston
Financial & listing details
- Price per square foot: $108/sqft
- Tax assessed value: $149,569
- Annual tax amount: $1,876
- Date on market: 1/22/2025
- Lease term: Contact For Details
Estimated market value
$77,800
$72,000 - $85,000
$1,715/mo
Price history
| Date | Event | Price |
|---|---|---|
| 6/27/2026 | Price change | $1,695-5.6%$1/sqft |
Source: | ||
| 6/6/2026 | Price change | $1,795-3%$1/sqft |
Source: | ||
| 5/18/2026 | Listed for rent | $1,850$1/sqft |
Source: | ||
| 1/7/2026 | Pending sale | $95,000$73/sqft |
Source: | ||
| 12/31/2025 | Price change | $95,000-2.6%$73/sqft |
Source: | ||
| 12/17/2025 | Price change | $97,500-7.1%$75/sqft |
Source: | ||
| 12/4/2025 | Price change | $105,000-2.8%$81/sqft |
Source: | ||
| 12/1/2025 | Price change | $108,000-1.8%$83/sqft |
Source: | ||
| 11/4/2025 | Price change | $110,000-12%$85/sqft |
Source: | ||
| 9/22/2025 | Price change | $125,000-10.7%$96/sqft |
Source: | ||
| 9/16/2025 | Price change | $140,000+7.7%$108/sqft |
Source: EXIT Realty broker feed #50678128 Report a problem | ||
| 8/27/2025 | Price change | $130,000-7.1%$100/sqft |
Source: | ||
| 7/24/2025 | Listed for sale | $140,000$108/sqft |
Source: | ||
| 7/23/2025 | Pending sale | $140,000$108/sqft |
Source: | ||
| 7/9/2025 | Price change | $140,000-7.9%$108/sqft |
Source: | ||
| 5/21/2025 | Price change | $152,000-3.5%$117/sqft |
Source: | ||
| 4/22/2025 | Price change | $157,500-7.3%$122/sqft |
Source: | ||
| 3/6/2025 | Price change | $169,900-8.2%$131/sqft |
Source: | ||
| 1/30/2025 | Price change | $185,000+12.1%$143/sqft |
Source: | ||
| 1/22/2025 | Listed for sale | $165,000$127/sqft |
Source: | ||
Public tax history
| Year | Property taxes | Tax assessment |
|---|---|---|
| 2025 | $1,876 | $149,569 +3.9% |
| 2024 | -- | $143,890 +3.7% |
| 2023 | -- | $138,703 +64.5% |
| 2022 | -- | $84,340 +64.5% |
| 2021 | -- | $51,264 -8.9% |
| 2020 | -- | $56,260 |
| 2019 | -- | $56,260 +16.2% |
| 2018 | -- | $48,414 |
| 2017 | -- | $48,414 |
| 2016 | -- | $48,414 +49.1% |
| 2015 | $584 | $32,476 |
| 2014 | $584 | $32,476 |
| 2013 | -- | $32,476 -46.8% |
| 2012 | -- | $60,999 |
| 2011 | -- | $60,999 |
| 2010 | -- | $60,999 |
| 2009 | -- | $60,999 |
| 2008 | -- | $60,999 |
| 2007 | -- | $60,999 +122.1% |
| 2006 | -- | $27,467 |
| 2005 | -- | -- |
| 2004 | -- | $22,700 +9.7% |
| 2003 | -- | $20,700 |
| 2002 | -- | $20,700 |
| 2001 | -- | $20,700 +191.5% |
| 2000 | -- | $7,100 |
Find assessor info on the county website
Monthly payment
Est. payment$--/mo
Payment breakdown
Explore the cost of this home by adjusting the details. Changes won't be saved.All calculations are estimates and provided by Zillow, Inc. for informational purposes only. Actual amounts may vary.
HOA fees may include property taxes on listings classified as Co-Ops. Contact the listing agent and/or owner for fee details.
Mortgage interest rates are dependent on a number of factors, including credit score, down payment, and repayment length. Interest rate data provided by Zillow Group Marketplace, Inc. as of 1/1/1970 from various mortgage lenders with which we have lead or other similar arrangements; the Estimated Payment is an average of those rates.
See how much you could borrow to make a competitive offer.
Climate risks
Neighborhood: Acres Home
Nearby schools
GreatSchools rating
- NAReece AcademyGrades: PK-KDistance: 1.1 mi
- 4/10Drew AcademyGrades: 7-8Distance: 0.5 mi
- 5/10Carver High School For Applied Tech/EngineGrades: 9-12Distance: 0.9 mi
A local agent can set up tours, give advice and negotiate with sellers.

- Texas
- Harris County
- Houston
- 77091
- Acres Home
- 2237 Wilburforce St
Nearby cities
Nearby neighborhoods
Nearby zip codes
Other Houston Topics
