Two family property in Pawtucket, Rhode Island. The first floor offers 3 bedrooms, 1 full bath, high ceilings, and a spacious living area. The second floor includes 2 bedrooms, 1 bath, plus a kitchen and living room layout. Detached 2-car garage offers potential for conversion to additional living space. Includes off-street parking. Ideal for investors or owner occupied with rental income potential.
Active
$499,900
23 Sisson St, Pawtucket, RI 02860
5beds
2,228sqft
Multi Family
Built in 1900
-- sqft lot
$-- Zestimate®
$224/sqft
$-- HOA
What's special
Off-street parkingHigh ceilings
- 16 days
- 372
- 16
Zillow last checked:
Listing updated:
Listed by:
Renato De Lima 401-440-2490,
Innovations Realty
Source: StateWide MLS RI,MLS#: 1427368
Facts & features
Interior
Bedrooms & bathrooms
- Bedrooms: 5
- Bathrooms: 2
- Full bathrooms: 2
Heating
- Natural Gas, Baseboard
Cooling
- None
Appliances
- Included: Gas Water Heater
- Laundry: In Building
Features
- Flooring: Ceramic Tile, Hardwood, Vinyl
- Basement: Full,Interior and Exterior,Unfinished
- Has fireplace: No
Interior area
- Total structure area: 3,645
- Total interior livable area: 2,228 sqft
Video & virtual tour
Property
Parking
- Total spaces: 8
- Parking features: Detached
- Garage spaces: 2
Lot
- Size: 5,000 Square Feet
Details
- Parcel number: PAWTM55L0274
Construction
Type & style
- Home type: MultiFamily
- Property subtype: Multi Family
- Attached to another structure: Yes
Materials
- Vinyl Siding
Condition
- New construction: No
- Year built: 1900
Utilities & green energy
- Electric: 100 Amp Service
- Utilities for property: Sewer Connected, Water Connected
Community & HOA
HOA
- Has HOA: No
Location
- Region: Pawtucket
Financial & listing details
- Price per square foot: $224/sqft
- Tax assessed value: $375,100
- Annual tax amount: $5,844
- Date on market: 10/30/2026
- Total actual rent: 2300
- Tenant pays: Heat
Estimated market value
Not available
Estimated sales range
Not available
Not available
Price history
| Date | Event | Price |
|---|---|---|
| 10/15/2026 | Listed for sale | $499,900+52632.1%$224/sqft |
Source:  StateWide MLS RI #1426065 Report a problem | ||
| 6/18/2019 | Sold | $948-99.4% |
Source: Public Record Report a problem | ||
| 5/11/2015 | Sold | $160,000-15.3%$72/sqft |
Source: Public Record Report a problem | ||
| 12/24/2014 | Listed for sale | $189,000$85/sqft |
Source: Realty Plus #1079425 Report a problem | ||
| 10/7/2014 | Listing removed | $189,000$85/sqft |
Source: Realty Plus #1079425 Report a problem | ||
| 9/23/2014 | Listed for sale | $189,000+124.5%$85/sqft |
Source: Realty Plus #1079425 Report a problem | ||
| 10/11/2013 | Sold | $84,200+15.5%$38/sqft |
Source: Public Record Report a problem | ||
| 8/14/2013 | Price change | $72,900-8.8%$33/sqft |
Source: Homepath #1042644 Report a problem | ||
| 8/10/2013 | Listed for sale | $79,900+432.7%$36/sqft |
Source: Homepath #1042644 Report a problem | ||
| 7/6/2013 | Listing removed | -- |
Source: Auction.com Report a problem | ||
| 7/2/2013 | Price change | $15,000-81.2%$7/sqft |
Source: Auction.com Report a problem | ||
| 6/23/2013 | Price change | $79,900+432.7%$36/sqft |
Source: Homepath #1042644 Report a problem | ||
| 6/22/2013 | Price change | $15,000-81.2%$7/sqft |
Source: Auction.com Report a problem | ||
| 5/30/2013 | Listed for sale | $79,900+25.8%$36/sqft |
Source: Homepath #1042644 Report a problem | ||
| 8/25/2012 | Listing removed | $63,500$29/sqft |
Source: Exit Realty Firm #1015249 Report a problem | ||
| 7/19/2012 | Price change | $63,500-9.3%$29/sqft |
Source: Exit Realty Firm #1015249 Report a problem | ||
| 6/20/2012 | Price change | $69,990-12.4%$31/sqft |
Source: Exit Realty Firm #1015249 Report a problem | ||
| 4/19/2012 | Listed for sale | $79,900$36/sqft |
Source: Homepath Report a problem | ||
Public tax history
| Year | Property taxes | Tax assessment |
|---|---|---|
| 2025 | $4,629 | $375,100 |
| 2024 | $4,629 +18.4% | $375,100 +59.1% |
| 2023 | $3,910 | $235,800 |
| 2022 | $3,910 | $235,800 |
| 2021 | $3,910 +6.3% | $235,800 +34% |
| 2020 | $3,677 | $176,000 |
| 2019 | $3,677 +3.8% | $176,000 |
| 2018 | $3,543 +13.8% | $176,000 +28.5% |
| 2017 | $3,113 +3.8% | $137,000 |
| 2016 | $2,999 | $137,000 |
| 2015 | $2,999 -7.6% | $137,000 -2.6% |
| 2014 | $3,245 | $140,700 |
| 2013 | $3,245 | $140,700 +900% |
| 2012 | $3,245 +10.1% | $14,070 -91.5% |
| 2011 | $2,948 | $165,800 |
| 2010 | $2,948 | $165,800 |
| 2009 | $2,948 +11.1% | $165,800 -22.6% |
| 2008 | $2,653 +4.5% | $214,100 |
| 2007 | $2,539 | $214,100 |
Find assessor info on the county website
Monthly payment
Est. payment
Payment breakdown
Explore the cost of this home by adjusting the details. Changes won't be saved.Climate risks
Neighborhood: Woodlawn
Similar homes
- $579,9994 bd2 ba2.2k sqft22 Boutwell St, Pawtucket, RI 02860For Sale
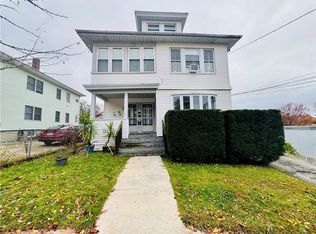
 MLS ID #1428441, Rosa Dominguez, My Dream Home Realty. StateWide MLS RI
- $518,0006 bd2 ba2k sqft51 Grace St, Pawtucket, RI 02860For Sale
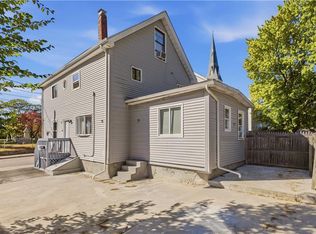 MLS ID #1427086, The Donovan Group, Homes By Connect. StateWide MLS RI
- $549,0006 bd2 ba2.4k sqft19 Dexter Ct, Pawtucket, RI 02860For Sale
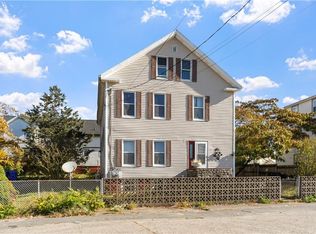 MLS ID #1427577, Sherri Maestas, Century 21 Envoy. StateWide MLS RI
- $550,0006 bd2 ba2.4k sqft578 Weeden St, Pawtucket, RI 02860For Sale
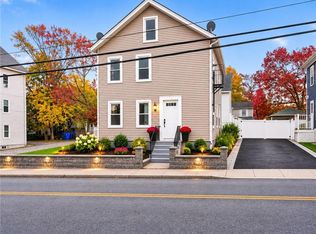 MLS ID #1427844, Marisela Vasquez, My Dream Home Realty. StateWide MLS RI
- $395,0006 bd2 ba2k sqft124 Anthony Ave, Pawtucket, RI 02860For SaleMLS ID #1428012, Elaine Reavey, Keller Williams Coastal. StateWide MLS RI
- $439,9004 bd3 ba2.1k sqft38 Wood St #40, Pawtucket, RI 02860For SaleMLS ID #1427581, Brenda L. Marchwicki, BisMarc Properties, LLC. StateWide MLS RI
- $549,0006 bd2 ba2.5k sqft68 Wilcox Ave, Pawtucket, RI 02860For SaleMLS ID #1421987, Roseann Halladay, RE/MAX Preferred. StateWide MLS RI
- $490,0004 bd2 ba1.4k sqft8 Thomas Ave, Pawtucket, RI 02860For SaleMLS ID #1422130, Alysandra Nemeth, Redfin Corporation. StateWide MLS RI
- $480,0005 bd3 ba2.2k sqft36 Cowden St, Central Falls, RI 02863For SaleMLS ID #1427757, Slocum Home Team, eXp Realty. StateWide MLS RI
- $419,9005 bd2 ba2.3k sqft113 Spring St, Pawtucket, RI 02860For SaleMLS ID #1428193, Juli McIntosh, RE/MAX Professionals. StateWide MLS RI
- $549,9994 bd2 ba2k sqft69 Bellevue Ave, Pawtucket, RI 02861For SaleMLS ID #1428491, Shanika Hodge, Real Broker, LLC. StateWide MLS RI
- $424,9005 bd2 ba1.8k sqft82 Jefferson Ave, Pawtucket, RI 02860For SaleMLS ID #1414560, Robin Pastore, CENTURY 21 Gonsalves - Pastore. StateWide MLS RI
- $425,0005 bd3 ba3.3k sqft71 S Bend St, Pawtucket, RI 02860For SaleMLS ID #1426005, Melissa Perrille, eXp Realty LLC. StateWide MLS RI
- $599,0005 bd4 ba2.8k sqft39 Highland St, Pawtucket, RI 02860For SaleMLS ID #1416488, Denis DaSilva, Revolv Real Estate. StateWide MLS RI
- $499,9006 bd3 ba3.1k sqft45 Harrison St, Pawtucket, RI 02860For SaleMLS ID #1420986, Betsey DaSilva, Noel Realty Company. StateWide MLS RI
- $469,9003 bd2 ba1.4k sqft165 Hunts Ave, Pawtucket, RI 02861For SaleMLS ID #1428404, Jay Rezendes, RE/MAX ONE. StateWide MLS RI
- $529,9008 bd3 ba3.2k sqft28 Chestnut St, Central Falls, RI 02863For SaleMLS ID #1428253, Carole McKeon, Real Broker, LLC. StateWide MLS RI
- $529,9005 bd3 ba2.5k sqft28 Enfield St, Pawtucket, RI 02861For SaleMLS ID #1427441, Luis Mateus, Mateus Realty. StateWide MLS RI
- $474,9003 bd2 ba2k sqft37 Trenton St, Pawtucket, RI 02860For SaleMLS ID #1421702, Sam Glicksman, Spitz-Weiss, REALTORS. StateWide MLS RI
- $474,9005 bd3 ba2.8k sqft70-72 Pacific St, Central Falls, RI 02863For SaleMLS ID #1427283, Robin Pastore, CENTURY 21 Gonsalves - Pastore. StateWide MLS RI
