Three-bedroom, two bath home in beautiful Ambleside Subdivision. All bedrooms are on the main level with a large bonus room located upstairs.
Pending
$274,000
230 Windermere Dr, Middlesboro, KY 40965
3beds
2,099sqft
Single Family Residence
Built in 2007
0.5 Acres Lot
$-- Zestimate®
$131/sqft
$-- HOA
What's special
Two bath
- 13 days
- 160
- 4
Likely to sell faster than
Zillow last checked:
Listing updated:
Listed by:
Mike Hensley 606-269-1737,
REMAX PROFESSIONAL'S
Source: East Tennessee Realtors,MLS#: 1360070
Facts & features
Interior
Bedrooms & bathrooms
- Bedrooms: 3
- Bathrooms: 2
- Full bathrooms: 2
Rooms
- Room types: Bonus Room
Heating
- Central, Heat Pump, Electric
Cooling
- Central Air, Ceiling Fan(s)
Appliances
- Included: Dishwasher, Range, Refrigerator
Features
- Walk-In Closet(s), Eat-in Kitchen, Bonus Room
- Flooring: Carpet, Hardwood, Vinyl
- Windows: Insulated Windows
- Basement: Crawl Space
- Has fireplace: No
- Fireplace features: None
Interior area
- Total structure area: 2,099
- Total interior livable area: 2,099 sqft
Property
Parking
- Total spaces: 2
- Parking features: Attached
- Attached garage spaces: 2
Features
- Has view: Yes
- View description: Mountain(s), Country Setting
Lot
- Size: 0.5 Acres
- Features: Irregular Lot, Rolling Slope
Details
- Parcel number: 0681000105.41
Construction
Type & style
- Home type: SingleFamily
- Architectural style: Traditional
- Property subtype: Single Family Residence
Materials
- Vinyl Siding, Brick
Condition
- Year built: 2007
Utilities & green energy
- Sewer: Public Sewer
- Water: Public
Community & HOA
Community
- Subdivision: Ambleside
Location
- Region: Middlesboro
Financial & listing details
- Price per square foot: $131/sqft
- Tax assessed value: $250,000
- Annual tax amount: $2,651
- Date on market: 10/26/2026
Estimated market value
Not available
Estimated sales range
Not available
Not available
Price history
| Date | Event | Price |
|---|---|---|
| 10/28/2026 | Pending sale | $274,000$131/sqft |
Source:  East Tennessee Realtors #1360070 Report a problem | ||
| 10/26/2026 | Listed for sale | $274,000+9.6%$131/sqft |
Source: East Tennessee Realtors #1360070 Report a problem | ||
| 5/5/2025 | Sold | $250,000-7.4%$119/sqft |
Source: East Tennessee Realtors #1271144 Report a problem | ||
| 1/30/2025 | Pending sale | $270,000$129/sqft |
Source: East Tennessee Realtors #1271144 Report a problem | ||
| 10/15/2024 | Price change | $270,000-1.8%$129/sqft |
Source: East Tennessee Realtors #1271144 Report a problem | ||
| 9/30/2024 | Price change | $275,000-1.8%$131/sqft |
Source: East Tennessee Realtors #1271144 Report a problem | ||
| 8/23/2024 | Price change | $280,000-1.8%$133/sqft |
Source: East Tennessee Realtors #1271144 Report a problem | ||
| 8/9/2024 | Price change | $285,000-1.7%$136/sqft |
Source: East Tennessee Realtors #1271144 Report a problem | ||
| 7/27/2024 | Listed for sale | $290,000+30.6%$138/sqft |
Source: East Tennessee Realtors #1271144 Report a problem | ||
| 8/1/2022 | Sold | $222,000-7.5%$106/sqft |
Source: East Tennessee Realtors #1196519 Report a problem | ||
| 6/26/2022 | Pending sale | $239,900$114/sqft |
Source: East Tennessee Realtors #1196519 Report a problem | ||
| 6/23/2022 | Listed for sale | $239,900+51.4%$114/sqft |
Source:  RE/MAX International #1196519 Report a problem | ||
| 11/17/2014 | Sold | $158,500$76/sqft |
Source: East Tennessee Realtors #888493 Report a problem | ||
Public tax history
| Year | Property taxes | Tax assessment |
|---|---|---|
| 2025 | $2,651 +3.3% | $250,000 +12.6% |
| 2024 | $2,566 -1.2% | $222,000 |
| 2023 | $2,597 +88.1% | $222,000 +40.1% |
| 2022 | $1,381 -1.6% | $158,500 |
| 2021 | $1,403 -25% | $158,500 |
| 2020 | $1,871 -0.7% | $158,500 |
| 2019 | $1,885 | $158,500 |
| 2018 | $1,885 | $158,500 |
| 2017 | -- | $158,500 |
| 2016 | -- | $158,500 -3.9% |
| 2014 | $1,606 +431.8% | $164,900 +6.3% |
| 2011 | $302 -76.4% | $155,200 |
| 2010 | $1,280 | $155,200 |
Find assessor info on the county website
Monthly payment
Est. payment
Payment breakdown
Explore the cost of this home by adjusting the details. Changes won't be saved.Climate risks
Neighborhood: 40965

Similar homes
- $279,0004 bd2 ba2k sqft400 Gloucester Ave, Middlesboro, KY 40965For Sale
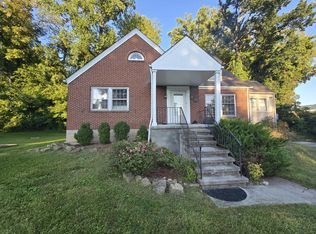
 MLS ID #26020497, Sheila Durham, Coldwell Banker Bisceglia Realty & Auction Co. Imagine MLS
- $230,0003 bd2 ba1.3k sqft156 Wellington Dr, Middlesboro, KY 40965For Sale
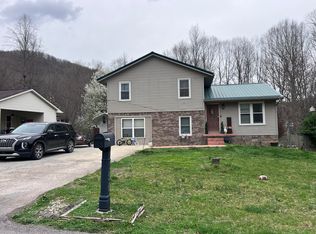 MLS ID #26005639, Megan Stanaford, Black Diamond Realty. Imagine MLS
- $199,9004 bd2 ba1.6k sqft140 Wellington Dr, Middlesboro, KY 40965Active
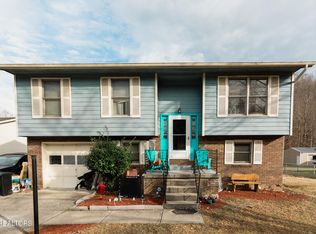
 MLS ID #1348714, Janice Pratt, Fathom Realty TN LLC. East Tennessee Realtors
- $229,5003 bd3 ba2k sqft301 Does Xing, Middlesboro, KY 40965Active
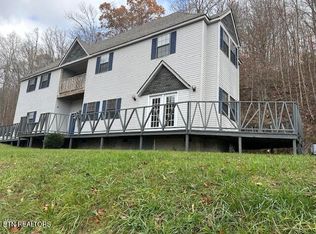 MLS ID #1328317, Virginia Wilder, Century 21 Virginia Wilder Real Estate. East Tennessee Realtors
- $299,0004 bd3 ba2.4k sqft1015 Old Wilson Ln, Middlesboro, KY 40965ActiveMLS ID #1356915, Misti McGrath, Realty Group. East Tennessee Realtors
- $289,9003 bd2 ba1.7k sqft646 High St, Harrogate, TN 37752ActiveMLS ID #1361204, Steve Mason, REMAX PROFESSIONAL'S. East Tennessee Realtors
- $320,0005 bd3 ba3k sqft103 Sherwood Rd, Middlesboro, KY 40965ActiveMLS ID #1357377, Misti McGrath, Realty Group. East Tennessee Realtors
- $160,0003 bd2 ba1.1k sqft8 Castleford Way, Middlesboro, KY 40965For SaleMLS ID #26025315, Victoria Allen, Century 21 Virginia Wilder Real Estate. Imagine MLS
- $200,0003 bd2 ba2.1k sqft116 Edgewood Rd, Middlesboro, KY 40965For SaleMLS ID #26013326, Megan Stanaford, Black Diamond Realty. Imagine MLS
- $219,0004 bd2 ba1.5k sqft812 Worchester Ave, Middlesboro, KY 40965ActiveMLS ID #1352799, Misti McGrath, Realty Group. East Tennessee Realtors
- $265,0002 bd3 ba1.6k sqft13953 Highway 190, Pineville, KY 40977For SaleMLS ID #26023958, Megan Stanaford, Black Diamond Realty. Imagine MLS
- $275,0004 bd2 ba1.3k sqft492 Loy Rd, Speedwell, TN 37870ActiveMLS ID #1361002, Misti McGrath, Realty Group. East Tennessee Realtors
- $275,5003 bd2 ba1.4k sqft97 Joe E Dell Rd, Pineville, KY 40977For SaleMLS ID #26024788, Lisa Stacy-Gibbs, Backwoods Realty & Development. Imagine MLS
- $199,0003 bd1 ba1.4k sqft1102 W Chester Ave, Middlesboro, KY 40965For SaleMLS ID #26022803, David Gambrell, Coldwell Banker Bisceglia Realty & Auction Co. Imagine MLS
- $264,9003 bd3 ba2.6k sqft262 Oxford Cir, Harrogate, TN 37752ActiveMLS ID #1324114, Steve Mason, REMAX PROFESSIONAL'S. East Tennessee Realtors
- $273,0003 bd2 ba1.5k sqft230 Adair Dr, New Tazewell, TN 37825ActiveMLS ID #1337361, Jackson Bledsoe, Stone Realty & Auction. East Tennessee Realtors
- $225,0003 bd2 ba2.2k sqft243 Goat Town Rd, Ewing, VA 24248ActiveMLS ID #1340480, Virginia Wilder, Century 21 Virginia Wilder Real Estate. East Tennessee Realtors
- $359,9003 bd2 ba1.5k sqft130 Jared Ln, Cumberland Gap, TN 37724ActiveMLS ID #1358158, D.J. Wilder, Century 21 Virginia Wilder Real Estate. East Tennessee Realtors
- $239,0003 bd2 ba1.5k sqft2022 Back Valley Rd, Speedwell, TN 37870ActiveMLS ID #1349383, Jennifer Yankee, Rocky Top Realty. East Tennessee Realtors
- $249,9003 bd2 ba2k sqft134 Allen Dr, Tazewell, TN 37879For Sale
 MLS ID #713312, Sarah Richards, Spring Mountain Realty, PLLC. Lakeway Area AOR
