Move in ready. Fresh paint throughout. New doors all. flooring four year old. New fan lights. Screen porch. Roof four years old. Finished large lanai Heat and cool.
For sale by owner
$219,900
2317 N Sarasota Point, Hernando, FL 34442
2beds
1,473sqft
SingleFamily
Built in 1987
7,640 Square Feet Lot
$211,600 Zestimate®
$149/sqft
$317/mo HOA
What's special
Screen porchFresh paint throughoutNew doorsFinished large lanaiNew fan lightsHeat and cool
- 221 days
- 262
- 8
Listed by:
Property Owner (352) 476-2580
Facts & features
Interior
Bedrooms & bathrooms
- Bedrooms: 2
- Bathrooms: 2
- Full bathrooms: 2
Heating
- Heat pump, Electric
Cooling
- Central
Features
- Eat-In Kitchen, Counters - Laminate, Blinds, Breakfast Bar, Split Floor Plan
- Flooring: Tile, Laminate
- Has fireplace: No
Interior area
- Total interior livable area: 1,473 sqft
Property
Parking
- Total spaces: 2
- Parking features: Garage - Attached
Features
- Exterior features: Other, Wood
Lot
- Size: 7,640 Square Feet
- Features: Cul-de-Sac, Flat
Details
- Parcel number: 19E18S190020001400360
- Zoning: PDR
Construction
Type & style
- Home type: SingleFamily
- Architectural style: Attached Villa
Materials
- Wood
- Foundation: Footing
- Roof: Asphalt
Condition
- New construction: No
- Year built: 1987
Community & HOA
HOA
- Has HOA: Yes
- HOA fee: $317 monthly
Location
- Region: Hernando
Financial & listing details
- Price per square foot: $149/sqft
- Tax assessed value: $190,117
- Annual tax amount: $1,066
- Date on market: 3/11/2026
Estimated market value
$211,600
$199,000 - $224,000
$1,831/mo
Price history
| Date | Event | Price |
|---|---|---|
| 9/20/2026 | Listed for sale | $219,900-2.2%$149/sqft |
Source: Owner Report a problem | ||
| 8/22/2026 | Listing removed | -- |
Source: Owner Report a problem | ||
| 5/24/2026 | Price change | $224,900-1.3%$153/sqft |
Source: Owner Report a problem | ||
| 3/11/2026 | Listed for sale | $227,900-0.9%$155/sqft |
Source: Owner Report a problem | ||
| 3/3/2026 | Listing removed | $229,900$156/sqft |
Source:  Realtors Association of Citrus County #847864 Report a problem | ||
| 2/1/2026 | Price change | $229,900-1.3%$156/sqft |
Source: Realtors Association of Citrus County #847864 Report a problem | ||
| 1/6/2026 | Price change | $232,900-1.1%$158/sqft |
Source: Realtors Association of Citrus County #847864 Report a problem | ||
| 12/15/2025 | Price change | $235,500-0.8%$160/sqft |
Source: Realtors Association of Citrus County #847864 Report a problem | ||
| 9/3/2025 | Price change | $237,500-1%$161/sqft |
Source: Realtors Association of Citrus County #847864 Report a problem | ||
| 8/6/2025 | Listed for sale | $240,000+2.1%$163/sqft |
Source: Owner Report a problem | ||
| 8/5/2025 | Listing removed | $235,000$160/sqft |
Source: Realtors Association of Citrus County #846694 Report a problem | ||
| 7/28/2025 | Pending sale | $235,000$160/sqft |
Source: Realtors Association of Citrus County #846694 Report a problem | ||
| 7/28/2025 | Listed for sale | $235,000+22.4%$160/sqft |
Source: Realtors Association of Citrus County #846694 Report a problem | ||
| 5/10/2023 | Sold | $192,000+92%$130/sqft |
Source: Public Record Report a problem | ||
| 3/24/2021 | Listing removed | -- |
Source: Owner Report a problem | ||
| 9/9/2019 | Sold | $100,000-19.4%$68/sqft |
Source: Public Record Report a problem | ||
| 9/5/2017 | Sold | $124,000-1.6%$84/sqft |
Source: Public Record Report a problem | ||
| 7/16/2017 | Listed for sale | $126,000+21.2%$86/sqft |
Source: Owner Report a problem | ||
| 7/13/2017 | Sold | $104,000$71/sqft |
Source: Realtors Association of Citrus County #760758 Report a problem | ||
| 6/20/2017 | Pending sale | $104,000$71/sqft |
Source: RE/MAX Realty One - CR #760758 Report a problem | ||
| 6/17/2017 | Listed for sale | $104,000-24.6%$71/sqft |
Source: RE/MAX Realty One - CR #760758 Report a problem | ||
| 7/3/2007 | Sold | $138,000$94/sqft |
Source: Public Record Report a problem | ||
Public tax history
| Year | Property taxes | Tax assessment |
|---|---|---|
| 2025 | $1,066 +8.2% | $99,094 +2.9% |
| 2024 | $985 -61.2% | $96,301 -37.3% |
| 2023 | $2,542 +14.7% | $153,610 +10% |
| 2022 | $2,216 +12.2% | $139,645 +10% |
| 2021 | $1,976 +5.1% | $126,950 +3.9% |
| 2020 | $1,880 +74.4% | $122,220 +15.1% |
| 2019 | $1,078 +2.9% | $106,189 +1.9% |
| 2018 | $1,047 +126.9% | $104,209 +69.3% |
| 2017 | $462 -18.8% | $61,540 +2.1% |
| 2016 | $568 | $60,274 +0.7% |
| 2015 | $568 +2.2% | $59,855 +0.8% |
| 2014 | $556 -0.8% | $59,380 -7.4% |
| 2013 | $560 -24.3% | $64,130 -23% |
| 2012 | $740 +3.6% | $83,295 +3% |
| 2011 | $714 -14.4% | $80,869 -9.7% |
| 2010 | $834 -13.2% | $89,553 -6.3% |
| 2009 | $961 -16.4% | $95,616 -11.4% |
| 2008 | $1,149 -37.6% | $107,948 -6.6% |
| 2007 | $1,841 +211.8% | $115,600 +94% |
| 2006 | $590 -4.3% | $59,600 +2.9% |
| 2005 | $617 +0.6% | $57,900 +2.8% |
| 2004 | $613 +6.4% | $56,300 +1.8% |
| 2003 | $576 +7.1% | $55,300 +2.2% |
| 2002 | $538 +4.9% | $54,100 +4% |
| 2000 | $513 | $52,000 |
Find assessor info on the county website
Monthly payment
Est. payment
Payment breakdown
Explore the cost of this home by adjusting the details. Changes won't be saved.Climate risks
Neighborhood: 34442

Similar homes
- $235,0003 bd2 ba1.6k sqft3671 E Arbor Lakes Dr, Hernando, FL 34442For Sale
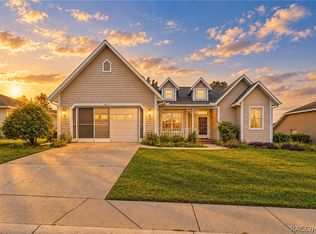 MLS ID #857919, Shaska Musikka-Velez, Century 21 J.W.Morton R.E.. Realtors Association of Citrus County
- $210,0002 bd2 ba1.3k sqft70 W Sugarmaple Ln, Beverly Hills, FL 34465For Sale
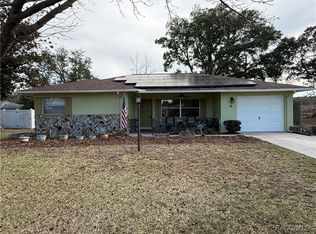 MLS ID #851630, Anthony Viggiano Jr., Tropic Shores Realty. Realtors Association of Citrus County
- $215,0002 bd2 ba1.6k sqft200 S Desoto St, Beverly Hills, FL 34465For Sale
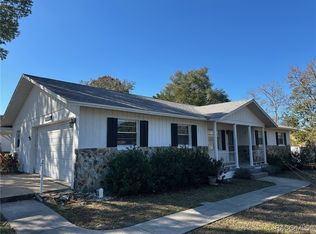 MLS ID #850694, Louis Newman, Keller Williams Realty - Elite Partners II. Realtors Association of Citrus County
- $225,0002 bd2 ba1.6k sqft17 Pennsylvania St, Beverly Hills, FL 34465For Sale By Owner
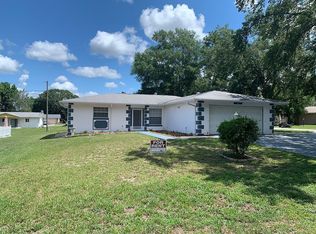
- $300,0003 bd3 ba1.8k sqft585 E FORESTHILL PLACE, HERNANDO, FL 34442For Sale
 MLS ID #TB8482425, Lissette Herrera, RED CASTLE REALTY FL. Stellar MLS
- $194,0003 bd2 ba1.2k sqft(Undisclosed Address), BEVERLY HILLS, FL 34465For SaleMLS ID #OM727548, Jolene Micilcavage, OCALA BROKERS & ASSOCIATES. Stellar MLS
- $172,5002 bd3 ba1.3k sqft810 E GILCHRIST COURT #3B, HERNANDO, FL 34442For SaleMLS ID #OM718857, Nicholas Melendez, GLOBALWIDE REALTY LLC. Stellar MLS
- $240,0002 bd2 ba1.2k sqft7223 S SESAME STREET TERRACE, HOMOSASSA, FL 34446For SaleMLS ID #TB8516722, Roxanne Bracewell, BRACEWELL & ASSOCIATES REALTY. Stellar MLS
- $220,0002 bd1 ba1.5k sqft20155 SW 81st Lane, Dunnellon, FL 34431For Sale
 MLS ID #799933, Rhonda Rogers, Hometown Realty of North Fl. Inc.. Dixie-Gilchrist Levy Counties BOR
- $223,0004 bd2 ba1.4k sqft2256 W GREENWAY PLACE, CITRUS SPRINGS, FL 34434For SaleMLS ID #P4938148, Candra Alston, DALTON WADE INC. Stellar MLS
- $125,0002 bd2 ba990 sqft95 E HARTFORD STREET Bldg 10, 8A, HERNANDO, FL 34442For SaleMLS ID #OM731056, Ernestine Brinager, TROPIC SHORES REALTY. Stellar MLS
- $225,0003 bd2 ba1.5k sqft10720 SW 62ND TERRACE, OCALA, FL 34476For SaleMLS ID #OM732218, Lori Busch, BUSCH REALTY. Stellar MLS
