Back on the market do to financing. charging 2-family home in Pawtucket's Woodlawn neighborhood. Each unit has 2 bedrooms and 1 full bathroom. Key updates are already done, including replacement windows and doors, and the property is lead-safe. The second-floor unit is vacant and ready for an owner-occupant to move in right away. The first-floor unit is rented below current market rates, which gives room to grow rental income over time. More features include a partially finished basement with extra space for storage or flexible use, separate utilities for each unit, off-street parking, and a spacious backyard.
Pending
$499,000
233 Randall St, Pawtucket, RI 02860
4beds
1,506sqft
Multi Family
Built in 1920
-- sqft lot
$497,700 Zestimate®
$331/sqft
$-- HOA
What's special
Spacious backyardOff-street parkingReplacement windows and doors
- 18 days
- 475
- 39
Zillow last checked:
Listing updated:
Listed by:
Lissette Guzman 401-230-6272,
Circle 100 Real Estate
Source: StateWide MLS RI,MLS#: 1427472
Facts & features
Interior
Bedrooms & bathrooms
- Bedrooms: 4
- Bathrooms: 2
- Full bathrooms: 2
Heating
- None, Baseboard, Gas Connected
Cooling
- None
Appliances
- Included: Gas Water Heater
Features
- Flooring: Ceramic Tile, Hardwood, Vinyl
- Basement: Full,Interior Entry,Finished
- Has fireplace: No
Interior area
- Total structure area: 4,100
- Total interior livable area: 1,506 sqft
Video & virtual tour
Property
Parking
- Parking features: No Garage
Lot
- Size: 1,507 Square Feet
Details
- Parcel number: PAWTM55L0091
Construction
Type & style
- Home type: MultiFamily
- Property subtype: Multi Family
- Attached to another structure: Yes
Materials
- Vinyl Siding
Condition
- New construction: No
- Year built: 1920
Utilities & green energy
- Electric: 100 Amp Service
- Sewer: Public Sewer
- Water: Public
Community & HOA
Community
- Subdivision: Woodlawn
HOA
- Has HOA: No
Location
- Region: Pawtucket
Financial & listing details
- Price per square foot: $331/sqft
- Tax assessed value: $331,300
- Annual tax amount: $4,088
- Date on market: 10/31/2026
- Total actual rent: 0
- Tenant pays: Heat
Estimated market value
$497,700
$473,000 - $523,000
$1,863/mo
Price history
| Date | Event | Price |
|---|---|---|
| 11/12/2026 | Pending sale | $499,000$331/sqft |
Source:  StateWide MLS RI #1427472 Report a problem | ||
| 10/31/2026 | Listed for sale | $499,000+31.3%$331/sqft |
Source: StateWide MLS RI #1427472 Report a problem | ||
| 12/26/2023 | Sold | $380,000+11.8%$252/sqft |
Source: StateWide MLS RI #1346745 Report a problem | ||
| 12/6/2023 | Pending sale | $340,000$226/sqft |
Source: StateWide MLS RI #1346745 Report a problem | ||
| 11/10/2023 | Contingent | $340,000$226/sqft |
Source: StateWide MLS RI #1346745 Report a problem | ||
| 11/7/2023 | Pending sale | $340,000$226/sqft |
Source: StateWide MLS RI #1346745 Report a problem | ||
| 11/3/2023 | Contingent | $340,000$226/sqft |
Source: StateWide MLS RI #1346745 Report a problem | ||
| 10/24/2023 | Listed for sale | $340,000+372.2%$226/sqft |
Source: StateWide MLS RI #1346745 Report a problem | ||
| 3/19/1998 | Sold | $72,000$48/sqft |
Source: Public Record Report a problem | ||
Public tax history
| Year | Property taxes | Tax assessment |
|---|---|---|
| 2025 | $4,088 | $331,300 |
| 2024 | $4,088 +19.4% | $331,300 +60.4% |
| 2023 | $3,424 | $206,500 |
| 2022 | $3,424 | $206,500 |
| 2021 | $3,424 +4.3% | $206,500 +31.4% |
| 2020 | $3,284 | $157,200 |
| 2019 | $3,284 +3.8% | $157,200 |
| 2018 | $3,164 +16.5% | $157,200 +31.4% |
| 2017 | $2,717 +3.8% | $119,600 |
| 2016 | $2,618 | $119,600 |
| 2015 | $2,618 -8.7% | $119,600 -3.8% |
| 2014 | $2,866 | $124,300 |
| 2013 | $2,866 | $124,300 +900% |
| 2012 | $2,866 +6.5% | $12,430 -91.8% |
| 2011 | $2,690 | $151,300 |
| 2010 | $2,690 | $151,300 |
| 2009 | $2,690 +12.7% | $151,300 -21.4% |
| 2008 | $2,386 +4.5% | $192,600 |
| 2007 | $2,284 +16.9% | $192,600 +76.5% |
| 2005 | $1,954 +3.8% | $109,100 |
| 2004 | $1,882 +4% | $109,100 |
| 2003 | $1,810 | $109,100 |
Find assessor info on the county website
Monthly payment
Est. payment
Payment breakdown
Explore the cost of this home by adjusting the details. Changes won't be saved.Climate risks
Neighborhood: Woodlawn


Similar homes
- $518,0006 bd2 ba2k sqft51 Grace St, Pawtucket, RI 02860For Sale
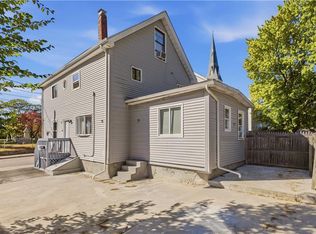
 MLS ID #1427086, The Donovan Group, Homes By Connect. StateWide MLS RI
- $489,9004 bd2 ba1.7k sqft33 Winthrop Ave, Pawtucket, RI 02861For Sale
 MLS ID #1424798, Sean Hevenor, RI Real Estate Services. StateWide MLS RI
- $519,0004 bd2 ba2.1k sqft128 Vincent Ave, North Providence, RI 02904For Sale
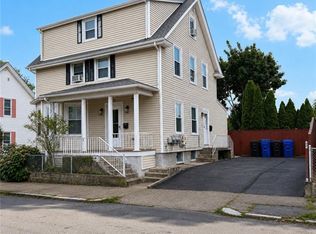 MLS ID #1420507, Livin Group, eXp Realty. StateWide MLS RI
- $600,0004 bd2 ba1.9k sqft53 Byron Ave, Pawtucket, RI 02861For Sale
 MLS ID #1427488, Yamanda Perez Jimenez, Circle 100 Real Estate. StateWide MLS RI
- $509,9004 bd2 ba1.5k sqft293 Sutton Ave, East Providence, RI 02914For SaleMLS ID #1421769, W. George Buteau, Engel & Volkers Oceanside. StateWide MLS RI
- $549,9005 bd2 ba1.5k sqft119 Chatham St, Providence, RI 02904For SaleMLS ID #1427579, Andy Andujar, Innovations Realty. StateWide MLS RI
- $475,0004 bd2 ba2.1k sqft35 Fenwood Ave, Smithfield, RI 02917For SaleMLS ID #1428297, Peter Conceicao, CENTURY 21 Gonsalves - Pastore. StateWide MLS RI
- $475,0004 bd2 ba1.4k sqft30 Eddington St, Pawtucket, RI 02861For SaleMLS ID #1423348, Team Dandurand, Dandurand Real Estate. StateWide MLS RI
- $545,0004 bd2 ba2.2k sqft47 Luna St, Providence, RI 02904For SaleMLS ID #1426305, Annmarie Sawyer, The Q Group Realty. StateWide MLS RI
- $500,0003 bd4 ba1.9k sqft786 Eddy St, Providence, RI 02905For SaleMLS ID #1422946, Herland Cabrera, Westcott Properties. StateWide MLS RI
- $499,9003 bd2 ba1.6k sqft25 Roberta St, North Providence, RI 02904For SaleMLS ID #1427142, Tara Cancel, Blackstone/Ocean Properties. StateWide MLS RI
- $445,0005 bd4 ba1.3k sqft12 Bryant St, Providence, RI 02908For SaleMLS ID #1427953, Lissette Guzman, Circle 100 Real Estate. StateWide MLS RI
- $459,9002 bd2 ba1.2k sqft69 Belmont Ave, East Providence, RI 02914For SaleMLS ID #1427372, Teresa Guaba, The Network. StateWide MLS RI
- $459,9003 bd3 ba1.7k sqft27 Gem St, North Providence, RI 02904For SaleMLS ID #1427702, Diana Noriega, Homes for Paws Realty Group. StateWide MLS RI
- $499,0003 bd2 ba1.9k sqft872 Greenville Ave, Johnston, RI 02919For SaleMLS ID #1428075, Debi Tofani, BHHS Pinnacle Realty. StateWide MLS RI
- $499,9004 bd4 ba1.7k sqft199 Benedict St, Providence, RI 02909For SaleMLS ID #1422260, Feng Lei, Green Island Realty, Inc.. StateWide MLS RI
- $499,9003 bd2 ba2.2k sqft210 Pinecrest Dr, Pawtucket, RI 02861For SaleMLS ID #1419226, Robin Pastore, CENTURY 21 Gonsalves - Pastore. StateWide MLS RI
- $535,0005 bd3 ba1.7k sqft1-2 Hale St, Providence, RI 02909For SaleMLS ID #1421631, Stateline Team, Stateline Real Estate. StateWide MLS RI
- $449,9006 bd2 ba1.9k sqft212 Roosevelt St, Providence, RI 02909For SaleMLS ID #1428579, Andre Marines, REALPRO by The Water. StateWide MLS RI
- $389,0002 bd1 ba882 sqft55 Legris Ave, Pawtucket, RI 02861For SaleMLS ID #1428692, Raymond Turcotte, Coldwell Banker Realty. StateWide MLS RI
