Build your dream home on this unique deep water homesite. 155 ft deep x 91ft wide on the water, situated just a few lots from the intracoastal waterway. NO HOA. No Fixed bridge. Sea wall in good shape. This lot is located on the south side of Edward Rd where the inlet is deep and well maintained and can easily accommodate a large boat. Many homes have already been newly built in this street. New sewer lines were just installed along the street for an easy tie in. Just south of Donald Ross and a short ride to the beach.
New construction
$2,750,000
2400 Edward Rd, Palm Beach Gardens, FL 33410
0beds
0baths
1,491sqft
Single Family Residence
Built in 2023
0.32 Acres Lot
$-- Zestimate®
$1,844/sqft
$-- HOA
What's special
- 1377 days
- 146
- 4
Zillow last checked:
Listing updated:
Listed by:
Maria Sajon 954-588-3158,
PG Florida Realty, LLC.
Source: MIAMI,MLS#: A11331141 Originating MLS: A-Miami Association of REALTORS
Facts & features
Interior
Bedrooms & bathrooms
- Bedrooms: 0
- Bathrooms: 0
Heating
- Other
Cooling
- Other
Features
- Other
- Flooring: Other
Interior area
- Total structure area: 2,136
- Total interior livable area: 1,491 sqft
Video & virtual tour
Property
Parking
- Parking features: None
Features
- Exterior features: None
- Has view: Yes
- View description: Canal
- Has water view: Yes
- Water view: Canal
- Waterfront features: WF/Ocean Access, No Fixed Bridges
- Frontage length: 91
Lot
- Size: 0.32 Acres
- Features: 1/4 To Less Than 1/2 Acre Lot
Details
- Parcel number: 00434129000005031
- Zoning: RS
- Other equipment: None
Construction
Type & style
- Home type: SingleFamily
- Architectural style: Other
- Property subtype: Single Family Residence
Materials
- Other
- Roof: Other
Condition
- New Construction
- New construction: Yes
- Year built: 2023
Utilities & green energy
- Sewer: Septic Tank
- Water: Municipal Water
Community & HOA
Community
- Subdivision: Unincorporated
HOA
- Has HOA: No
Location
- Region: Palm Beach Gardens
Financial & listing details
- Price per square foot: $1,844/sqft
- Tax assessed value: $1,470,000
- Annual tax amount: $15,268
- Date on market: 1/21/2023
- Listing terms: Conventional
- Road surface type: Paved Road
Estimated market value
Not available
Estimated sales range
Not available
Not available
Price history
| Date | Event | Price |
|---|---|---|
| 10/3/2024 | Listed for sale | $2,750,000-1.8%$1,844/sqft |
Source:  MIAMI #A11331141 Report a problem | ||
| 1/21/2023 | Listed for sale | $2,800,000+72.3%$1,878/sqft |
Source: MIAMI #A11331141 Report a problem | ||
| 8/15/2022 | Sold | $1,625,000-12.2%$1,090/sqft |
Source:  BeachesMLS #R10801565 Report a problem | ||
| 8/3/2022 | Pending sale | $1,850,000$1,241/sqft |
Source:  RE/MAX International #RX-10801565 Report a problem | ||
| 8/3/2022 | Contingent | $1,850,000$1,241/sqft |
Source: BeachesMLS #RX-10801565 Report a problem | ||
| 7/19/2022 | Price change | $1,850,000-5.1%$1,241/sqft |
Source: BeachesMLS #RX-10801565 Report a problem | ||
| 7/9/2022 | Listed for sale | $1,950,000$1,308/sqft |
Source: BeachesMLS #RX-10801565 Report a problem | ||
| 7/2/2022 | Pending sale | $1,950,000$1,308/sqft |
Source: RE/MAX International #RX-10801565 Report a problem | ||
| 7/2/2022 | Contingent | $1,950,000$1,308/sqft |
Source: BeachesMLS #RX-10801565 Report a problem | ||
| 6/24/2022 | Price change | $1,950,000-15%$1,308/sqft |
Source: BeachesMLS #RX-10801565 Report a problem | ||
| 6/13/2022 | Price change | $2,295,000-4.2%$1,539/sqft |
Source: BeachesMLS #RX-10801565 Report a problem | ||
| 5/20/2022 | Listed for sale | $2,395,000+323.9%$1,606/sqft |
Source: BeachesMLS #RX-10801565 Report a problem | ||
| 7/9/2014 | Sold | $565,000-12.9%$379/sqft |
Source: BeachesMLS #R10028453 Report a problem | ||
| 5/23/2014 | Price change | $649,000-7.3%$435/sqft |
Source: The Keyes Company #RX-10028453 Report a problem | ||
| 3/30/2014 | Listed for sale | $700,000+250%$469/sqft |
Source: The Keyes Company #RX-10028453 Report a problem | ||
| 8/18/1993 | Sold | $200,000$134/sqft |
Source: Public Record Report a problem | ||
Public tax history
| Year | Property taxes | Tax assessment |
|---|---|---|
| 2025 | $22,513 +14.8% | $1,320,000 +10% |
| 2024 | $19,618 -15% | $1,200,000 -14.3% |
| 2023 | $23,089 +51.2% | $1,400,000 +91% |
| 2022 | $15,267 +20.7% | $732,960 +10% |
| 2021 | $12,651 +14% | $666,327 +10% |
| 2020 | $11,100 -7.7% | $605,752 -6.8% |
| 2019 | $12,023 | $649,927 +6.1% |
| 2018 | $12,023 +10.6% | $612,339 +11.2% |
| 2017 | $10,872 +8.7% | $550,698 +10.8% |
| 2016 | $9,999 +4.1% | $497,217 +10% |
| 2015 | $9,605 +83.4% | $452,015 +51.1% |
| 2014 | $5,238 +1.3% | $299,171 +1.5% |
| 2013 | $5,169 -2% | $294,750 +1.7% |
| 2012 | $5,275 +1% | $289,823 +3% |
| 2011 | $5,222 +1.1% | $281,382 +1.5% |
| 2010 | $5,166 +7.3% | $277,224 +2.7% |
| 2009 | $4,813 +12.2% | $269,936 +0.1% |
| 2008 | $4,288 +1% | $269,666 +3% |
| 2007 | $4,245 -6.2% | $261,812 +2.5% |
| 2006 | $4,526 | $255,426 +3% |
| 2005 | -- | $247,986 +3% |
| 2004 | $2,201 +909.5% | $240,763 +1.9% |
| 2003 | $218 -94.9% | $236,274 +2.4% |
| 2002 | $4,271 +0.5% | $230,736 +1.6% |
| 2001 | $4,249 +5% | $227,102 +16.7% |
| 2000 | $4,048 +12.7% | $194,664 +6.3% |
| 1999 | $3,593 | $183,067 |
Find assessor info on the county website
Monthly payment
Est. payment
Payment breakdown
Explore the cost of this home by adjusting the details. Changes won't be saved.Climate risks
Neighborhood: 33410
- $1,375,0004 bd4 ba2.8k sqft2410 Edward Rd, Palm Beach Gardens, FL 33410Sold
- $2,004,7004 bd2 ba2.4k sqft2382 Edward Rd, Palm Beach Gardens, FL 33410Off Market

- $3,420,900-- bd-- ba-- sqft2465 Treasure Isle Dr, Palm Beach Gardens, FL 33410Off Market
- $1,752,6004 bd3 ba2.2k sqft2401 Edward Rd, Palm Beach Gardens, FL 33410Off Market
Similar homes
- $2,397,0003 bd3 ba2.1k sqft154 Jupiter Key Road, Jupiter, FL 33477For Sale
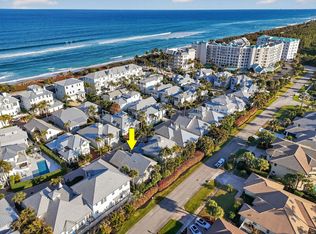
 MLS ID #B26089678, Ann P Cusa, Serhant. BeachesMLS
- $2,199,0003 bd2 ba1.9k sqft13519 Treasure Cove Circle, North Palm Beach, FL 33408For Sale
 MLS ID #R11156415, Nicholas Chris Meligonis, Paradise Real Estate Intl. BeachesMLS
- $2,799,0003 bd2 ba1.5k sqft319 Plymouth Road, West Palm Beach, FL 33405For Sale
 MLS ID #B26072430, Tom Davis, Coldwell Banker/ WPB. BeachesMLS
- $2,145,0003 bd2 ba1.9k sqftCarriage House, North Palm Beach, FL 33408For Sale
 MLS ID #26-506, ROBERT B THOMSON, Waterfront Properties & Club Communities 6621. Palm Beach BOR
- $1,625,0003 bd2 ba2k sqft10644 Avenue Of The Pga, Palm Beach Gardens, FL 33418For SaleMLS ID #B26041223, Scott D Smith PA, Compass Florida LLC. BeachesMLS
- $2,795,0003 bd4 ba2.1k sqftWater Club, North Palm Beach, FL 33408For SaleMLS ID #B26080418, Thomas Ashley Cooper, The Keyes Company. BeachesMLS
- $2,145,0003 bd2 ba1.9k sqftFrenchmans Harbor, North Palm Beach, FL 33408For Sale
 MLS ID #A11981702, Robert Thomson, Waterfront Properties & Club C. MIAMI
- $3,150,0003 bd3 ba1.9k sqft18150 PERIGON Way, Jupiter, FL 33458For SaleMLS ID #B26083862, Carla Ann Christenson, One Sotheby's International Realty. BeachesMLS
- $1,499,0003 bd2 ba1.2k sqft430 Neptune Road, Juno Beach, FL 33408For SaleMLS ID #B26075834, Susan Caruana, Holland Real Estate & Home Advisory. BeachesMLS
- $2,800,0003 bd4 ba2.1k sqftWater Club 3 North, North Palm Beach, FL 33408For SaleMLS ID #A11985959, Charlotte Tomic, BHHS EWM Realty. MIAMI
- $2,500,0003 bd4 ba2.1k sqft338 Palmetto Street, West Palm Beach, FL 33405For SaleMLS ID #B26092126, Anastasia Gudilina, Compass Florida, LLC. BeachesMLS
- $1,850,0003 bd2 ba2k sqft13501 Treasure Cove Circle, North Palm Beach, FL 33408For SaleMLS ID #B26031308, Robert Bruce Thomson, Waterfront Properties & Club C. BeachesMLS
- $3,035,0002 bd2 ba1.8k sqft2833 F Road, Loxahatchee Groves, FL 33470For SaleMLS ID #B26085059, Phillis M Maniglia PA., Partnership Realty Inc.. BeachesMLS
- $3,195,0003 bd2 ba2.1k sqft16411 Jupiter Farms Road, Jupiter, FL 33478For SaleMLS ID #B26015773, Erica Wolfe, Real Broker, LLC. BeachesMLS
- $1,499,0003 bd2 ba1.6k sqft14654 Peace River Way, Palm Beach Gardens, FL 33418For SaleMLS ID #B26062006, Cynthia E Stage, RE/MAX Ocean Properties. BeachesMLS
- $2,250,0003 bd2 ba1.8k sqft310 SPYGLASS Way, Jupiter, FL 33477For SaleMLS ID #B26088444, Gabriella Piccirilli, One Sotheby's International Re. BeachesMLS
- $1,950,0003 bd3 ba2.1k sqftBeachfront, Juno Beach, FL 33408For SaleMLS ID #A12109833, Anne Bosso, Robert Bosso Rlty Ser., Inc. MIAMI
- $2,400,0002 bd3 ba1.9k sqft220 Lake Shore Drive #1802, Lake Park, FL 33403For SaleMLS ID #B26090708, Dylan P Snyder, Compass Florida LLC. BeachesMLS
- $2,795,0002 bd2 ba1.2k sqft44 COCOANUT Row #222A, Palm Beach, FL 33480For SaleMLS ID #B26091095, Steven Koleno, Beycome of Florida LLC. BeachesMLS
- $1,895,0003 bd2 ba2.2k sqft324 Sandal Lane, Palm Beach Shores, FL 33404For SaleMLS ID #B26084399, Claudia Krinke, Douglas Elliman. BeachesMLS
