2421 North Capitol Avenue, Indianapolis, IN. Turnkey investment opportunity or ideal owner-occupant setup. Each unit offers 4 bedrooms and 2 full baths, featuring updated finishes, functional layouts, and strong rental potential. Convenient location near downtown, close to parks, Ivy Tech, and neighborhood revitalization projects. Whether you're looking to live in one unit and rent the other, or add a solid property to your portfolio, this one checks the boxes
Active
$400,000
2421 N Capitol Ave, Indianapolis, IN 46208
4beds
2baths
--sqft
Multi Family, Duplex
Built in 1920
-- sqft lot
$-- Zestimate®
$--/sqft
$-- HOA
What's special
Functional layoutsUpdated finishes
- 104 days
- 89
- 0
Zillow last checked:
Listing updated:
Listed by:
Ely Berger ely@themodglingroup.com,
The Modglin Group
Source: MIBOR as distributed by MLS GRID,MLS#: 22118086
Facts & features
Interior
Bedrooms & bathrooms
- Bedrooms: 4
- Bathrooms: 2
Features
- Has basement: Yes
Property
Features
- Levels: Multi/Split,Two
- Stories: 2
Details
- Parcel number: 490626108065000101
Construction
Type & style
- Home type: MultiFamily
- Property subtype: Multi Family, Duplex
Materials
- Brick
Condition
- New construction: No
- Year built: 1920
Community & HOA
Community
- Subdivision: F M Becks Sub Rhodes N Illinois St Add
Location
- Region: Indianapolis
Financial & listing details
- Tax assessed value: $84,200
- Annual tax amount: $2,050
- Date on market: 8/4/2026
- Cumulative days on market: 324 days
Estimated market value
Not available
Estimated sales range
Not available
Not available
Price history
| Date | Event | Price |
|---|---|---|
| 8/4/2026 | Listed for sale | $400,000 |
Source:  MIBOR as distributed by MLS GRID #22118086 Report a problem | ||
| 7/14/2026 | Listing removed | $400,000 |
Source: MIBOR as distributed by MLS GRID #22089015 Report a problem | ||
| 6/18/2026 | Price change | $400,000-7% |
Source: MIBOR as distributed by MLS GRID #22089015 Report a problem | ||
| 3/13/2026 | Listed for sale | $430,000-3.4% |
Source: MIBOR as distributed by MLS GRID #22089015 Report a problem | ||
| 2/20/2026 | Listing removed | $445,000 |
Source: MIBOR as distributed by MLS GRID #22066845 Report a problem | ||
| 1/19/2026 | Price change | $445,000-1.1% |
Source: MIBOR as distributed by MLS GRID #22066845 Report a problem | ||
| 10/8/2025 | Listed for sale | $450,000+53.1% |
Source: MIBOR as distributed by MLS GRID #22066845 Report a problem | ||
| 10/16/2024 | Sold | $294,000-26.5% |
Source: Public Record Report a problem | ||
| 9/28/2022 | Sold | $400,000+77.8% |
Source: Public Record Report a problem | ||
| 9/6/2022 | Listed for sale | $225,000 |
Source: MIBOR as distributed by MLS GRID #21862551 Report a problem | ||
| 8/29/2022 | Pending sale | $225,000 |
Source: MIBOR as distributed by MLS GRID #21862551 Report a problem | ||
| 6/23/2022 | Listed for sale | $225,000 |
Source: MIBOR as distributed by MLS GRID #21862551 Report a problem | ||
Public tax history
| Year | Property taxes | Tax assessment |
|---|---|---|
| 2025 | $1,917 +9.5% | $84,200 +4.2% |
| 2024 | $1,751 | $80,800 +9.5% |
| 2023 | -- | $73,800 -30.2% |
| 2022 | $1,569 -1.5% | $105,800 +55.6% |
| 2021 | $1,593 +0.4% | $68,000 -1.2% |
| 2020 | $1,586 +15.6% | $68,800 +2.4% |
| 2019 | $1,372 -17.7% | $67,200 +16.7% |
| 2018 | $1,666 -8.6% | $57,600 +9.1% |
| 2017 | $1,823 +170.5% | $52,800 +5.6% |
| 2016 | $674 +3.9% | $50,000 +66.7% |
| 2014 | $649 -68.5% | $30,000 -67.5% |
| 2013 | $2,060 | $92,400 +0.9% |
| 2012 | $2,060 | $91,600 +29% |
| 2011 | -- | $71,000 |
| 2010 | $1,481 -5.1% | $71,000 |
| 2009 | $1,560 | $71,000 +7.1% |
| 2007 | -- | $66,300 |
Find assessor info on the county website
Monthly payment
Est. payment
Payment breakdown
Explore the cost of this home by adjusting the details. Changes won't be saved.Climate risks
Neighborhood: Near Northside

Similar homes
- $359,9994 bd3 ba-- sqft713 W 32nd St, Indianapolis, IN 46208Active
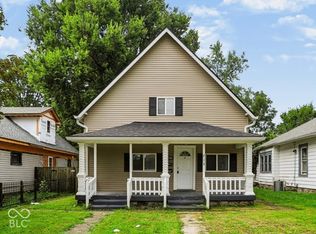 MLS ID #22129108, Shannon McGibboney, Carpenter, REALTORS®. MIBOR as distributed by MLS GRID
- $364,9994 bd2 ba-- sqft1339 N Gale St, Indianapolis, IN 46201Active
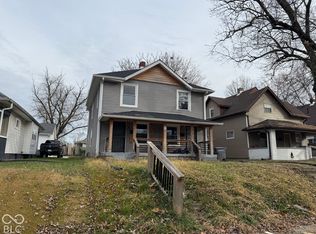 MLS ID #22129663, Ely Berger, The Modglin Group. MIBOR as distributed by MLS GRID
- $387,8004 bd3 ba3.2k sqft2946 Broadway St, Indianapolis, IN 46205Active
 MLS ID #22111895, Gib Barker, Exceptional Homes Realty. MIBOR as distributed by MLS GRID
- $260,0005 bd2 ba-- sqft802 Udell St, Indianapolis, IN 46208Active
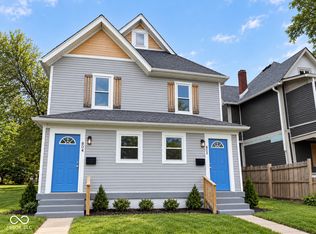 MLS ID #22124804, Ely Berger, The Modglin Group. MIBOR as distributed by MLS GRID
