Coastal living meets opportunity in the Cherry Quay! Situated on a spacious 0.26-acre corner lot, this elevated ranch offers 3 bedrooms and 2 bathrooms with room to bring your vision to life. Recent improvements include a newer roof, updated siding, select windows and doors, and substantial rough plumbing and electrical work. The unfinished interior provides a blank canvas for customizing the layout, finishes, and overall design to suit your plans. Enjoy a location near waterways, boating opportunities, beaches, dining, and popular Jersey Shore attractions. Whether you are planning a renovation project or exploring the potential of a coastal property, this home offers an opportunity to create something special. Schedule a showing at 25 Boom Ln! All photos are Virtually Staged/Enhanced
For sale
$449,000
25 Boom Lane, Brick, NJ 08723
3beds
1,312sqft
Single Family Residence
Built in 1968
0.26 Acres Lot
$443,500 Zestimate®
$342/sqft
$-- HOA
What's special
- 28 days
- 2,067
- 147
Likely to sell faster than
Zillow last checked:
Listing updated:
Listed by:
Peter Boutros 908-913-8708,
EXP Realty
Source: MoreMLS,MLS#: 22632294
Facts & features
Interior
Bedrooms & bathrooms
- Bedrooms: 3
- Bathrooms: 2
- Full bathrooms: 2
Cooling
- None
Features
- Basement: Crawl Space,Unfinished,Walk-Out Access
Interior area
- Total structure area: 1,312
- Total interior livable area: 1,312 sqft
Property
Parking
- Parking features: Driveway
- Has uncovered spaces: Yes
Features
- Stories: 1
Lot
- Size: 0.26 Acres
- Dimensions: 112 x 100
Details
- Parcel number: 0700326000000002
Construction
Type & style
- Home type: SingleFamily
- Architectural style: Raised Ranch,Ranch
- Property subtype: Single Family Residence
Condition
- Year built: 1968
Utilities & green energy
- Sewer: Public Sewer
Community & HOA
Community
- Subdivision: Cherry Quay
HOA
- Has HOA: No
Location
- Region: Brick
Financial & listing details
- Price per square foot: $342/sqft
- Tax assessed value: $260,900
- Annual tax amount: $7,081
- Date on market: 10/17/2026
- Inclusions: None
Estimated market value
$443,500
$421,000 - $466,000
$3,325/mo
Price history
| Date | Event | Price |
|---|---|---|
| 10/17/2026 | Listed for sale | $449,000+12.3%$342/sqft |
Source:  MoreMLS #22632294 Report a problem | ||
| 9/8/2026 | Listing removed | $400,000$305/sqft |
Source: MoreMLS #22628024 Report a problem | ||
| 9/5/2026 | Listed for sale | $400,000-11%$305/sqft |
Source: MoreMLS #22628024 Report a problem | ||
| 8/5/2026 | Listing removed | $449,500$343/sqft |
Source: MoreMLS #22623858 Report a problem | ||
| 8/3/2026 | Listed for sale | $449,500$343/sqft |
Source: MoreMLS #22623858 Report a problem | ||
| 3/28/2026 | Listing removed | $449,500$343/sqft |
Source: MoreMLS #22530885 Report a problem | ||
| 10/11/2025 | Listed for sale | $449,500-3.3%$343/sqft |
Source:  GSMLS #3992083 Report a problem | ||
| 8/4/2025 | Listing removed | $465,000$354/sqft |
Source: MoreMLS #22519641 Report a problem | ||
| 7/2/2025 | Listed for sale | $465,000-5.1%$354/sqft |
Source: MoreMLS #22519641 Report a problem | ||
| 6/16/2025 | Listing removed | $490,000$373/sqft |
Source: MoreMLS #22516404 Report a problem | ||
| 6/4/2025 | Listed for sale | $490,000$373/sqft |
Source: MoreMLS #22516404 Report a problem | ||
Public tax history
| Year | Property taxes | Tax assessment |
|---|---|---|
| 2023 | $6,322 +2.2% | $260,900 |
| 2022 | $6,189 | $260,900 |
| 2021 | $6,189 +3% | $260,900 |
| 2020 | $6,011 +2.4% | $260,900 |
| 2019 | $5,870 +2.8% | $260,900 |
| 2018 | $5,711 +0.5% | $260,900 |
| 2017 | $5,682 +2.7% | $260,900 |
| 2016 | $5,534 +0.8% | $260,900 |
| 2015 | $5,489 +1.8% | $260,900 |
| 2014 | $5,393 +3.4% | $260,900 |
| 2013 | $5,218 +0.8% | $260,900 |
| 2012 | $5,176 +6.7% | $260,900 |
| 2011 | $4,850 +4.7% | $260,900 |
| 2010 | $4,633 +2.2% | $260,900 +123.4% |
| 2009 | $4,535 +6.2% | $116,800 |
| 2008 | $4,269 | $116,800 |
| 2007 | -- | $116,800 |
| 2006 | $3,602 | $116,800 |
| 2004 | -- | $116,800 |
| 2003 | -- | $116,800 |
| 2002 | -- | $116,800 |
| 2001 | -- | $116,800 |
Find assessor info on the county website
Monthly payment
Est. payment
Payment breakdown
Explore the cost of this home by adjusting the details. Changes won't be saved.Climate risks
Neighborhood: Cherry Quay

Similar homes
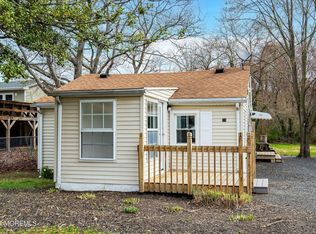
- $450,0002 bd1 ba710 sqft913 Cypress Ave, Brick, NJ 08723For Sale
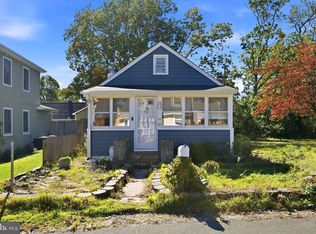
 MLS ID #NJOC2045930, Gregory Broome, RE/MAX at Barnegat Bay - Forked River. Bright MLS
- $414,9002 bd2 ba1.5k sqft14 Ashford Drive, Brick, NJ 08723For Sale

 MLS ID #22622295, Laureen DiMatteo, Berkshire Hathaway HomeServices Fox & Roach - Spring Lake. MoreMLS
- $430,0002 bd1 ba960 sqft525 Jackson Avenue, Brick, NJ 08723For Sale
 MLS ID #22615647, Enrique Beltra, Weichert Realtors-Brick. MoreMLS
- $415,0002 bd2 ba1.6k sqft138 Lions Head Boulevard S, Brick, NJ 08723For Sale
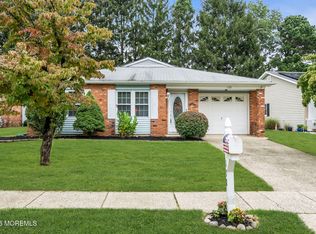 MLS ID #22628242, Louisa Sagarese, RE/MAX Revolution. MoreMLS
- $374,9992 bd1 ba900 sqft2595 Hooper Avenue, Brick, NJ 08723For SaleMLS ID #22627897, Andre Leonardo DiStefano, Douglas Elliman of NJ LLC. MoreMLS
- $549,9003 bd3 ba1.8k sqft857 Stapleton Avenue, Brick, NJ 08723For SaleMLS ID #22624731, Sondra Hurley Iannuzzi, Crossroads Realty, Inc.. MoreMLS
- $489,9003 bd2 ba1.6k sqft763 Garfield Avenue, Toms River, NJ 08753For SaleMLS ID #22634967, Jena DeMarco, Crossroads Realty, Inc.. MoreMLS
- $562,9004 bd2 ba1.9k sqft280 Dogwood Drive, Brick, NJ 08723For SaleMLS ID #22630156, Alexander Guarino, Daunno Realty Services. MoreMLS
- $449,9004 bd2 ba1.5k sqft32 E Long Branch Avenue, Ocean Gate, NJ 08740For SaleMLS ID #22633444, James Flanagan, Coldwell Banker Flanagan Realty. MoreMLS
- $415,0002 bd2 ba1.2k sqft51 Central Boulevard, Brick, NJ 08724For SaleMLS ID #22627819, Monica Buletza, Keller Williams Realty Ocean Living. MoreMLS
- $409,0003 bd1 ba1.4k sqft115 Swan Blvd, Toms River, NJ 08753For SaleMLS ID #NJOC2045804, Patricia Gesswein, Houwzer LLC-Haddonfield. Bright MLS
- $599,9004 bd2 ba1.8k sqft317 Silver Bay Road, Toms River, NJ 08753For SaleMLS ID #22633828, Isaac Nussbaum, Real Broker, LLC- Toms River. MoreMLS
- $435,0003 bd2 ba1.2k sqft1001 Pensacola Rd, Forked River, NJ 08731For SaleMLS ID #NJOC2046294, Camille Simms, RE/MAX at Barnegat Bay - Toms River. Bright MLS
- $479,9003 bd2 ba1.4k sqft740 10th Avenue, Toms River, NJ 08757For SaleMLS ID #22619031, Devora Berger, HomeSmart First Advantage. MoreMLS
- $450,0004 bd2 ba1.6k sqft53 Southwind Dr, Waretown, NJ 08758For SaleMLS ID #NJOC2046200, Lindsay Gold, EXP Realty, LLC. Bright MLS
- $635,0004 bd2 ba1.7k sqft445 Bella Vista Road, Brick, NJ 08724For SaleMLS ID #22631441, Caitlyn Mulligan, RE/MAX Revolution. MoreMLS
- $644,5283 bd2 ba1.6k sqft341 Jefferson Court, Brick, NJ 08724For SaleMLS ID #22631697, Donna Connelly, Coldwell Banker Realty. MoreMLS
- $490,0004 bd2 ba1.7k sqft17 Darye Ct, Toms River, NJ 08755For SaleMLS ID #NJOC2044348, Rosie McGeehan, Exit Realty Jersey Shore. Bright MLS
- $455,0002 bd2 ba1.6k sqft44 La Dunette Drive, Toms River, NJ 08757For SaleMLS ID #22634477, Jennifer Czarnecki, Crossroads Realty, Inc.. MoreMLS
