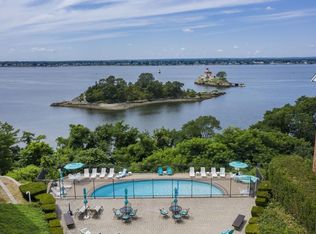
Lovely 2 bed, 1 and a half bath condo at the desirable Stone-gate Condominiums. Newly renovated main bathroom with walk in shower and renovated 1/2 bath. Enjoy the sun on your own balcony, or walk down to ocean view in-ground pool and Pomham Lighthouse. Steps away from the East Bay Bike Path.
Active
Price cut: $10K (11/5)
$280,000
25 Bullocks Point Ave APT 5C, Riverside, RI 02915
2beds
875sqft
Condominium
Built in 1981
-- sqft lot
$285,000 Zestimate®
$320/sqft
$350/mo HOA
What's special
Ocean view in-ground poolOwn balcony
- 22 days
- 66
- 1
Zillow last checked:
Listing updated:
Listed by:
Zhongyuan Williams 508-287-1404,
Coldwell Banker Realty
Source: StateWide MLS RI,MLS#: 1426056
Facts & features
Interior
Bedrooms & bathrooms
- Bedrooms: 2
- Bathrooms: 2
- Full bathrooms: 1
- 1/2 bathrooms: 1
Heating
- Electric, Baseboard
Cooling
- Wall Unit(s)
Features
- Flooring: Hardwood
- Basement: Full,Interior Entry,Unfinished
- Has fireplace: No
- Fireplace features: None
Interior area
- Total structure area: 875
- Total interior livable area: 875 sqft
- Finished area above ground: 875
- Finished area below ground: 0
Video & virtual tour
Property
Parking
- Total spaces: 1
- Parking features: No Garage, Assigned
Features
- Stories: 3
Details
- Parcel number: EPROM311B01L026U25C
Construction
Type & style
- Home type: Condo
- Property subtype: Condominium
Materials
- Brick
- Foundation: Concrete Perimeter
Condition
- New construction: No
- Year built: 1981
Utilities & green energy
- Electric: 100 Amp Service
- Sewer: Public Sewer
- Water: Public
Community & HOA
HOA
- Has HOA: No
- HOA fee: $350 monthly
Location
- Region: Riverside
Financial & listing details
- Price per square foot: $320/sqft
- Tax assessed value: $255,800
- Annual tax amount: $3,343
- Date on market: 10/15/2026
Estimated market value
$285,000
$271,000 - $299,000
$2,137/mo
Price history
| Date | Event | Price |
|---|---|---|
| 11/5/2026 | Price change | $280,000-3.4%$320/sqft |
Source:  StateWide MLS RI #1426056 Report a problem | ||
| 10/15/2026 | Listed for sale | $290,000$331/sqft |
Source: StateWide MLS RI #1426056 Report a problem | ||
| 10/1/2026 | Listing removed | $290,000$331/sqft |
Source: StateWide MLS RI #1419576 Report a problem | ||
| 8/2/2026 | Listed for sale | $290,000-1.7%$331/sqft |
Source: StateWide MLS RI #1419576 Report a problem | ||
| 8/1/2026 | Listing removed | $295,000$337/sqft |
Source: StateWide MLS RI #1396525 Report a problem | ||
| 1/23/2026 | Price change | $295,000-1.3%$337/sqft |
Source: StateWide MLS RI #1396525 Report a problem | ||
| 9/30/2025 | Price change | $299,000+7.2%$342/sqft |
Source: StateWide MLS RI #1396525 Report a problem | ||
| 8/25/2025 | Price change | $279,000-6.4%$319/sqft |
Source: StateWide MLS RI #1389805 Report a problem | ||
| 8/19/2025 | Price change | $298,000-0.3%$341/sqft |
Source: StateWide MLS RI #1389805 Report a problem | ||
| 7/11/2025 | Listed for sale | $299,000+45.9%$342/sqft |
Source: StateWide MLS RI #1389805 Report a problem | ||
| 3/17/2023 | Sold | $205,000+24.2%$234/sqft |
Source: Public Record Report a problem | ||
| 6/1/2004 | Sold | $165,000+236.7%$189/sqft |
Source: Public Record Report a problem | ||
| 4/29/1991 | Sold | $49,000$56/sqft |
Source: Public Record Report a problem | ||
Public tax history
| Year | Property taxes | Tax assessment |
|---|---|---|
| 2025 | $3,343 +8.1% | $255,800 +26.8% |
| 2024 | $3,092 +3.9% | $201,700 |
| 2023 | $2,977 +6.5% | $201,700 +57.7% |
| 2022 | $2,796 +1.2% | $127,900 -0.5% |
| 2021 | $2,763 +4.4% | $128,500 |
| 2020 | $2,646 +2.8% | $128,500 |
| 2019 | $2,573 +3.5% | $128,500 +18.2% |
| 2018 | $2,487 +2.3% | $108,700 |
| 2017 | $2,432 +0.5% | $108,700 |
| 2016 | $2,420 -4.8% | $108,700 -1.8% |
| 2015 | $2,541 | $110,700 |
| 2014 | $2,541 +0.8% | $110,700 |
| 2013 | $2,522 -5.1% | $110,700 +764.2% |
| 2012 | $2,657 +3.2% | $12,810 -90% |
| 2011 | $2,574 +3.5% | $128,100 |
| 2010 | $2,486 +2.9% | $128,100 -18.1% |
| 2009 | $2,415 +3.5% | $156,500 |
| 2008 | $2,333 +3.5% | $156,500 |
| 2007 | $2,255 | $156,500 |
Find assessor info on the county website
Monthly payment
Est. payment
Payment breakdown
Explore the cost of this home by adjusting the details. Changes won't be saved.Climate risks
Neighborhood: Riverside
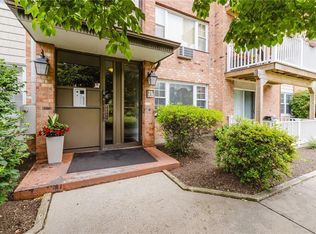
- $310,0002 bd2 ba942 sqft25 Bullocks Point Ave APT 3A, Riverside, RI 02915Sold
- $295,3002 bd2 ba1k sqft25 Bullocks Point Ave APT 1A, East providence, RI 02915Off Market
- $300,2002 bd2 ba1k sqft25 Bullocks Point Ave APT 1B, Riverside, RI 02915Off Market
- $287,5002 bd1 ba1k sqft25 Bullocks Point Ave APT 1C, Riverside, RI 02915Off Market
Similar homes
- $242,5002 bd1 ba900 sqftRiverview Terrace, Cranston, RI 02910For Sale
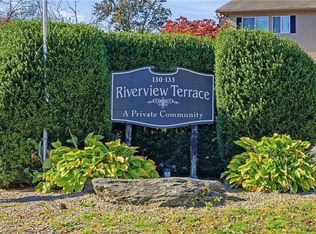
 MLS ID #1426622, Kristin Sheehan, Keller Williams Leading Edge. StateWide MLS RI
- $299,9002 bd2 ba1.1k sqftParkwood East, Cranston, RI 02920For Sale
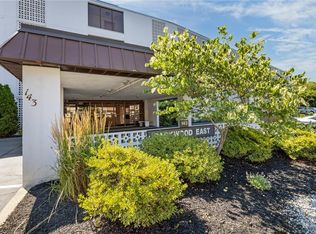 MLS ID #1418873, Teresa Marcella, Noonan/Lombardi, REALTORS. StateWide MLS RI
- $265,0001 bd2 ba1k sqftVillage Green, Warwick, RI 02888For Sale
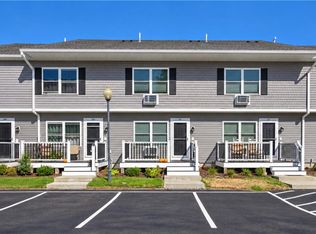 MLS ID #1424340, Shannon Krasnowiecki, RI Real Estate Services. StateWide MLS RI
- $278,9002 bd2 ba1.2k sqftRenaissance: Pleasant View, Pawtucket, RI 02860For Sale
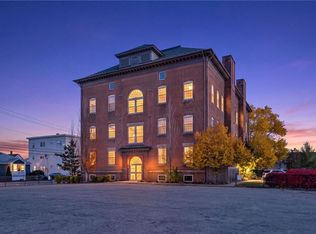 MLS ID #1427700, Jose Duce Rocher, Century 21 Limitless. StateWide MLS RI
- $325,0002 bd2 ba1.1k sqftParkwood East Condominimums, Cranston, RI 02920For SaleMLS ID #1425337, Joseph Caprara, REMAX Revolution. StateWide MLS RI
- $310,0002 bd2 ba965 sqftBlackstone Landing, Pawtucket, RI 02860For SaleMLS ID #1422184, Kelly Boucher, Re/Max Real Estate Center. StateWide MLS RI
- $399,9903 bd2 ba1.1k sqft1356 S Broadway, East Providence, RI 02914For SaleMLS ID #1427699, Kassi Mazzucco, Compass. StateWide MLS RI
- $374,0002 bd1 ba756 sqft114 Crown Ave, Riverside, RI 02915For SaleMLS ID #1426759, Maureen Fisher, Keller Williams South Watuppa. StateWide MLS RI
- $185,0002 bd1 ba756 sqftStonebrook, Warwick, RI 02889For SaleMLS ID #1427668, Justin Freitas, CENTURY 21 Gonsalves - Pastore. StateWide MLS RI
- $350,0002 bd2 ba1k sqftBowen Court, Riverside, RI 02915For SaleMLS ID #1421297, Flora Rocha, Keller Williams South Watuppa. StateWide MLS RI
- $269,9002 bd1 ba1k sqftKirkbrae Glen, Lincoln, RI 02865For SaleMLS ID #1427303, Mandy Roberts, Century 21 AllPoints Realty. StateWide MLS RI
- $299,9992 bd2 ba1k sqftDale Hill Condominiums, Johnston, RI 02919For SaleMLS ID #1427078, Alexandra Bell, Century 21 Envoy. StateWide MLS RI
- $299,9002 bd2 ba1.1k sqftPlainfield Valley, Johnston, RI 02919For SaleMLS ID #1426258, Jacob Rochefort, Mott & Chace Sotheby's Intl.. StateWide MLS RI
- $360,0002 bd1 ba842 sqft56-58 Columbia Ave. Condominiums, Cranston, RI 02905For SaleMLS ID #1425624, Sara Mandell, Churchill & Banks Co., LLC. StateWide MLS RI
- $289,9002 bd3 ba990 sqftVillage Green At Apponaug, Warwick, RI 02886For SaleMLS ID #1424714, Shawn Michalek, Pilot Real Estate. StateWide MLS RI
- $324,9002 bd2 ba1.1k sqftQuaker Valley Condominium, West Warwick, RI 02893For SaleMLS ID #1419485, Pat Corso, RI Real Estate Services. StateWide MLS RI
- $289,9001 bd1 ba528 sqftParkside Condominiums, Providence, RI 02906For SaleMLS ID #1421926, The Rachel Jones Team, SKD Real Estate. StateWide MLS RI
- $309,5002 bd2 ba1.1k sqftPlainfield Valley, Johnston, RI 02919For SaleMLS ID #1424627, Pat Cruz, Williams & Stuart Real Estate. StateWide MLS RI
- $239,9003 bd1 ba828 sqftVillas Of Federal Hill, Providence, RI 02909For SaleMLS ID #1426398, Kristina St. Andre, Westcott Properties. StateWide MLS RI
- $389,9002 bd1 ba909 sqftWethersfield Commons, Warwick, RI 02886For SaleMLS ID #1426767, Robert Rinn, RE/MAX Professionals. StateWide MLS RI
