Coming Soon.
Showings can be scheduled after 11/5.
New flooring throughout every room - neutral fresh paint. Updated: light fixtures - bathrooms. Clean & move in ready. Selling as is but inspections are of course allowed & all buyers agents are welcome to show.
For sale by owner
Street View
$184,000
2605 Selkirk Rd, Springfield, IL 62702
3beds
1,800sqft
SingleFamily
Built in 1970
-- sqft lot
$-- Zestimate®
$102/sqft
$-- HOA
What's special
Neutral fresh paint
- 12 days
- 408
- 15
Listed by:
Property Owner (217) 415-3798
Facts & features
Interior
Bedrooms & bathrooms
- Bedrooms: 3
- Bathrooms: 2
- Full bathrooms: 2
Interior area
- Total interior livable area: 1,800 sqft
Property
Details
- Parcel number: 14230227029
Construction
Type & style
- Home type: SingleFamily
Condition
- New construction: No
- Year built: 1970
Community & HOA
Location
- Region: Springfield
Financial & listing details
- Price per square foot: $102/sqft
- Tax assessed value: $125,979
- Annual tax amount: $2,509
- Date on market: 10/28/2026
Estimated market value
Not available
Estimated sales range
Not available
$1,655/mo
Price history
| Date | Event | Price |
|---|---|---|
| 10/28/2026 | Listed for sale | $184,000+41.5%$102/sqft |
Source: Owner Report a problem | ||
| 5/19/2026 | Sold | $130,000$72/sqft |
Source:  RMLS Alliance as distributed by MLS GRID #CA1043133 Report a problem | ||
| 4/27/2026 | Pending sale | $130,000$72/sqft |
Source: RMLS Alliance as distributed by MLS GRID #CA1043133 Report a problem | ||
| 4/23/2026 | Listed for sale | $130,000$72/sqft |
Source: RMLS Alliance as distributed by MLS GRID #CA1043133 Report a problem | ||
Public tax history
| Year | Property taxes | Tax assessment |
|---|---|---|
| 2025 | $2,509 +54.6% | $41,993 +7.2% |
| 2024 | $1,624 -5% | $39,165 +9.5% |
| 2023 | $1,709 -1.3% | $35,774 +6.3% |
| 2022 | $1,732 -0.4% | $33,639 +3.9% |
| 2021 | $1,740 +2.2% | $32,379 -0.2% |
| 2020 | $1,703 +4.3% | $32,428 +0.3% |
| 2019 | $1,633 | $32,315 -2.5% |
| 2018 | $1,633 +0.8% | $33,132 +1.3% |
| 2017 | $1,620 -8.5% | $32,703 +1.5% |
| 2016 | $1,770 +9.6% | $32,226 +1.2% |
| 2015 | $1,616 +0.9% | $31,841 +0.6% |
| 2014 | $1,602 +2.3% | $31,636 +1.8% |
| 2013 | $1,566 -6.4% | $31,063 |
| 2012 | $1,674 +2.5% | $31,063 |
| 2011 | $1,633 +5.2% | $31,063 +1% |
| 2010 | $1,551 +1.6% | $30,765 +1.4% |
| 2009 | $1,527 +0.4% | $30,329 +4.2% |
| 2008 | $1,522 -2.1% | $29,106 +0.9% |
| 2007 | $1,555 +0.6% | $28,841 +3.8% |
| 2006 | $1,545 | $27,783 |
Find assessor info on the county website
Monthly payment
Est. payment
Payment breakdown
Explore the cost of this home by adjusting the details. Changes won't be saved.Climate risks
Neighborhood: 62702

Similar homes
- $182,5003 bd2 ba2k sqft2400 Cahokia Dr, Springfield, IL 62702For Sale
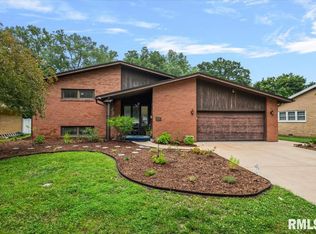
 MLS ID #CA1045313, Michael D Oldenettel, The Real Estate Group, Inc.. RMLS Alliance as distributed by MLS GRID
- $157,5003 bd2 ba1.3k sqft1000 Johnson Ln, Springfield, IL 62702For Sale
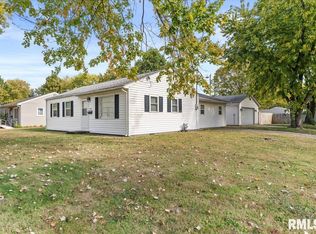 MLS ID #CA1047614, Joshua F Kruse, The Real Estate Group, Inc.. RMLS Alliance as distributed by MLS GRID
- $142,0003 bd2 ba1.7k sqft1718 Fairmont Dr, Springfield, IL 62702For Sale
 MLS ID #CA1047450, Kaye Brittin, RE/MAX Professionals. RMLS Alliance as distributed by MLS GRID
- $149,9003 bd3 ba1.8k sqft2073 N 22nd St, Springfield, IL 62702For Sale
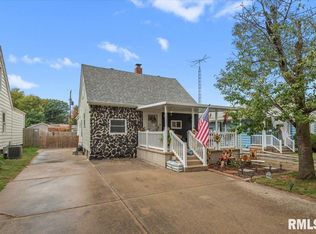 MLS ID #CA1047202, Logan Frazier, The Real Estate Group, Inc.. RMLS Alliance as distributed by MLS GRID
- $169,0003 bd2 ba1.7k sqft8 Bel Aire Dr, Springfield, IL 62703For SaleMLS ID #CA1047561, Ketki Arya, The Real Estate Group, Inc.. RMLS Alliance as distributed by MLS GRID
- $166,0005 bd2 ba2k sqft1812 E Converse Ave, Springfield, IL 62702For SaleMLS ID #CA1046198, Jim Fulgenzi, RE/MAX Professionals. RMLS Alliance as distributed by MLS GRID
- $158,0003 bd1 ba1.9k sqft1829 N 22nd St, Springfield, IL 62702For SaleMLS ID #CA1047200, Arielle Guemes, Century 21 Real Estate Assoc. RMLS Alliance as distributed by MLS GRID
- $191,0003 bd2 ba1.6k sqft93 Circle Dr, Springfield, IL 62703For SaleMLS ID #CA1047497, Suzie Sables Duff, RE/MAX Professionals. RMLS Alliance as distributed by MLS GRID
- $149,9003 bd2 ba1.3k sqft1828 Grant St, Springfield, IL 62703For SaleMLS ID #CA1047585, Kevin G Graham, Century 21 Real Estate Assoc. RMLS Alliance as distributed by MLS GRID
- $189,9003 bd2 ba1.4k sqft2313 S Walnut St, Springfield, IL 62704For SaleMLS ID #CA1047571, Tim Frederick, Campo Realty, Inc.. RMLS Alliance as distributed by MLS GRID
- $199,9003 bd2 ba2.1k sqft17 Amherst Dr, Springfield, IL 62702For SaleMLS ID #CA1047360, Nikki Machin, The Real Estate Group, Inc.. RMLS Alliance as distributed by MLS GRID
- $124,9003 bd3 ba1.4k sqft1814 N 30th St, Springfield, IL 62702For SaleMLS ID #CA1046826, Tracie Taylor, RE/MAX Professionals. RMLS Alliance as distributed by MLS GRID
- $169,9004 bd2 ba1.2k sqft1515-1517 Maryland Ave, Springfield, IL 62702For SaleMLS ID #CA1044197, Lisa A Haggerty, Keller Williams Capital. RMLS Alliance as distributed by MLS GRID
- $137,5004 bd4 ba1.9k sqft2601 Delaware Dr, Springfield, IL 62702For SaleMLS ID #CA1047552, Stephanie L Do, Do Realty Services, Inc.. RMLS Alliance as distributed by MLS GRID
- $149,9003 bd3 ba2.1k sqft1036 W Washington St, Springfield, IL 62702For SaleMLS ID #CA1046911, Khaled Hussein, Keller Williams Capital. RMLS Alliance as distributed by MLS GRID
- $230,0003 bd2 ba1.8k sqft200 Nottingham Rd, Springfield, IL 62704For SaleMLS ID #CA1047579, Andrew Kinney, The Real Estate Group, Inc.. RMLS Alliance as distributed by MLS GRID
- $190,0004 bd3 ba1.8k sqft206 S State St, Springfield, IL 62704For SaleMLS ID #CA1046545, Joshua F Kruse, The Real Estate Group, Inc.. RMLS Alliance as distributed by MLS GRID
- $174,9005 bd2 ba1.8k sqft63 Villanova Dr, Springfield, IL 62703For SaleMLS ID #CA1045185, John T McIntyre, Do Realty Services, Inc.. RMLS Alliance as distributed by MLS GRID
