Whether you're looking for a place to call home or your next investment property, this home offers plenty of potential. Currently tenant occupied, with the tenant scheduled to vacate November 1. Please allow appropriate notice for showings and do not disturb the tenant. Listing photos were taken in July 2024 prior to the current tenant's occupancy and may not represent the property's current condition. Buyer/Buyer's Agent to verify all information.
For sale
$80,000
26873 Kitch St, Inkster, MI 48141
2beds
720sqft
Single Family Residence
Built in 1950
6,098 Square Feet Lot
$-- Zestimate®
$111/sqft
$-- HOA
What's special
- 37 days
- 151
- 22
Zillow last checked:
Listing updated:
Listed by:
Logan Cook 313-277-7777,
RE/MAX Leading Edge 313-277-7777
Source: Realcomp II,MLS#: 20261081283
Facts & features
Interior
Bedrooms & bathrooms
- Bedrooms: 2
- Bathrooms: 1
- Full bathrooms: 1
Bedroom
- Level: Entry
- Area: 81
- Dimensions: 9 X 9
Bedroom
- Level: Entry
- Area: 99
- Dimensions: 9 X 11
Other
- Level: Entry
Heating
- Forced Air, Natural Gas
Features
- Basement: Unfinished
- Has fireplace: No
Interior area
- Total interior livable area: 720 sqft
- Finished area above ground: 720
Property
Parking
- Total spaces: 1
- Parking features: One Car Garage, Detached
- Garage spaces: 1
Features
- Levels: One
- Stories: 1
- Entry location: GroundLevelwSteps
- Pool features: None
Lot
- Size: 6,098 Square Feet
- Dimensions: 45 x 135
Details
- Parcel number: 44022010128000
- Special conditions: Short Sale No,Standard
Construction
Type & style
- Home type: SingleFamily
- Architectural style: Ranch
- Property subtype: Single Family Residence
Materials
- Aluminum Siding
- Foundation: Basement, Block
Condition
- New construction: No
- Year built: 1950
Utilities & green energy
- Sewer: Public Sewer
- Water: Public
Community & HOA
Community
- Subdivision: WESTWOOD SUB OF VAN ALSTINE FARM
HOA
- Has HOA: No
Location
- Region: Inkster
Financial & listing details
- Price per square foot: $111/sqft
- Tax assessed value: $15,946
- Annual tax amount: $1,533
- Date on market: 10/7/2026
- Cumulative days on market: 38 days
- Listing agreement: Exclusive Right To Sell
- Listing terms: Cash,Conventional
Estimated market value
Not available
Estimated sales range
Not available
$1,237/mo
Price history
| Date | Event | Price |
|---|---|---|
| 10/7/2026 | Listed for sale | $80,000+14.4%$111/sqft |
Source:  Realcomp II #20261081283 Report a problem | ||
| 6/20/2024 | Listing removed | -- |
Source: Zillow Rentals Report a problem | ||
| 6/19/2024 | Listed for rent | $1,100$2/sqft |
Source: Zillow Rentals Report a problem | ||
| 6/18/2024 | Listing removed | -- |
Source: Zillow Rentals Report a problem | ||
| 6/14/2024 | Listed for rent | $1,100$2/sqft |
Source: Zillow Rentals Report a problem | ||
| 6/14/2024 | Listing removed | -- |
Source: Zillow Rentals Report a problem | ||
| 4/26/2024 | Listed for rent | $1,100$2/sqft |
Source: Zillow Rentals Report a problem | ||
| 4/26/2024 | Listing removed | -- |
Source: Zillow Rentals Report a problem | ||
| 4/1/2024 | Listed for rent | $1,100$2/sqft |
Source: Zillow Rentals Report a problem | ||
| 4/1/2024 | Listing removed | -- |
Source: Zillow Rentals Report a problem | ||
| 2/14/2024 | Listed for rent | $1,100$2/sqft |
Source: Zillow Rentals Report a problem | ||
| 2/14/2024 | Listing removed | -- |
Source: Zillow Rentals Report a problem | ||
| 12/6/2023 | Listed for rent | $1,100$2/sqft |
Source: Zillow Rentals Report a problem | ||
| 10/30/2018 | Sold | $69,900+66.4%$97/sqft |
Source: Public Record Report a problem | ||
| 1/8/2018 | Sold | $42,000$58/sqft |
Source: Public Record Report a problem | ||
Public tax history
| Year | Property taxes | Tax assessment |
|---|---|---|
| 2026 | -- | $40,300 +8.9% |
| 2025 | -- | $37,000 +54.2% |
| 2024 | -- | $24,000 +24.4% |
| 2023 | -- | $19,300 +10.3% |
| 2022 | -- | $17,500 +17.4% |
| 2021 | -- | $14,900 |
| 2020 | $1,272 +27.1% | $14,900 +16.4% |
| 2019 | $1,001 | $12,800 +5.8% |
| 2018 | $1,001 | $12,100 +3.4% |
| 2017 | -- | $11,700 -1.7% |
| 2016 | $1,137 | $11,900 -14.4% |
| 2015 | $1,137 -35% | $13,900 -20.6% |
| 2013 | $1,750 +53.9% | $17,500 -8.9% |
| 2012 | $1,137 | $19,200 -20.3% |
| 2010 | -- | $24,100 -7.3% |
| 2009 | -- | $26,000 -16.4% |
| 2008 | -- | $31,100 +4% |
| 2007 | -- | $29,900 +14.1% |
| 2005 | $718 | $26,200 +6.9% |
| 2003 | -- | $24,500 +62.5% |
| 2001 | $1,032 +4.7% | $15,074 +3.2% |
| 2000 | $985 | $14,607 |
Find assessor info on the county website
Monthly payment
Est. payment
Payment breakdown
Explore the cost of this home by adjusting the details. Changes won't be saved.Climate risks
Neighborhood: 48141


Similar homes
- $79,9003 bd1 ba915 sqft26653 Oakland St, Inkster, MI 48141For Sale
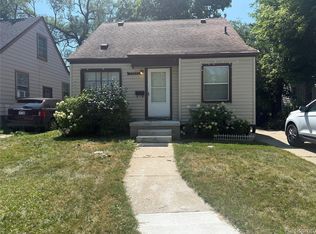
 MLS ID #20261068850, Fay Salmaci, ARG Realty. Realcomp II
- $99,9003 bd1 ba1k sqft1014 Arlington St, Inkster, MI 48141For Sale
 MLS ID #20261044468, Mike Dominick, Golden Path Real Estate Co. Realcomp II
- $108,0003 bd1 ba1k sqft27366 Freda St, Inkster, MI 48141For Sale
 MLS ID #20261070045, Logan Cook, RE/MAX Leading Edge. Realcomp II
- $99,9002 bd1 ba738 sqft24375 Hopkins St, Dearborn Heights, MI 48125For Sale
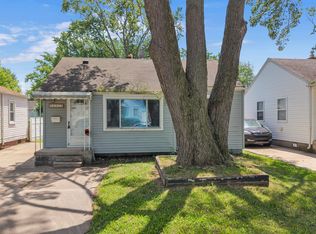 MLS ID #20261089924, Michael M Phillips, Keller Williams Legacy. Realcomp II
- $75,0002 bd1 ba840 sqft19410 Rutherford St, Detroit, MI 48235For SaleMLS ID #20261091016, Lashawn Peterson, EXP Realty Main. Realcomp II
- $115,0003 bd1 ba1k sqft3107 Henry St, Inkster, MI 48141For SaleMLS ID #20261026005, Shantell N Burton, Aaisha Gilmer. Realcomp II
- $79,9003 bd1 ba916 sqft7701 Vaughan St, Detroit, MI 48228For Sale
 MLS ID #26044895, Kristian Freiwald, Domus Realty. MichRIC
- $85,0003 bd1 ba1k sqft12021 Heyden St, Detroit, MI 48228For Sale
 MLS ID #50225121, Bradford Lack, Berkshire Hathaway HomeServices Kee Realty SCS. MiRealSource
- $84,0003 bd1 ba886 sqft8056 Vaughan St, Detroit, MI 48228For SaleMLS ID #20261052829, Christopher Stearns, CJR Realty. Realcomp II
- $99,9003 bd1 ba965 sqft7128 Cherokee St, Taylor, MI 48180For SaleMLS ID #20261088996, Tim Muflihi, RE/MAX Team 2000. Realcomp II
- $74,9003 bd1 ba768 sqft6386 Evergreen Ave, Detroit, MI 48228For SaleMLS ID #20261056886, Qassim Al-Omairi, ARG Realty. Realcomp II
- $69,9002 bd1 ba749 sqft9078 Artesian St, Detroit, MI 48228For SaleMLS ID #20261081348, Patrick A Peteet, Peteet's Realty. Realcomp II
- $98,2002 bd1 ba764 sqft18820 Norborne, Redford, MI 48240For SaleMLS ID #26059612, George Petrentzev, George Petrentzev. MichRIC
- $95,0002 bd1 ba705 sqft18655 Wood St, Melvindale, MI 48122For SaleMLS ID #20261079951, Mark Nasser, RE/MAX Leading Edge. Realcomp II
- $119,9002 bd1 ba664 sqft6120 Marvin St, Taylor, MI 48180For SaleMLS ID #26057837, Gurjeet Singh, National Realty Centers Northv. MichRIC
- $69,9002 bd1 ba720 sqft3957 13th St, Ecorse, MI 48229For SaleMLS ID #20261079551, Erica Skapyak, JWH Real Estate LLC. Realcomp II
- $69,9003 bd1 ba1k sqft2456 Electric St, Detroit, MI 48217For SaleMLS ID #20261090269, Derek C Lievens, Market Elite Inc. Realcomp II
- $72,4002 bd1 ba710 sqft14336 Rockdale St, Detroit, MI 48223For SaleMLS ID #20261045340, Greg Majewski, Detroit Investment Company. Realcomp II
- $79,9003 bd1 ba869 sqft15643 Chicago Ave, Detroit, MI 48228For SaleMLS ID #20251021967, Herbert J Hill Jr, Herbert J Hill Realty Real Estate Master. Realcomp II
- $79,9002 bd1 ba700 sqft7535 Toepfer Rd, Warren, MI 48091For SaleMLS ID #20261089743, Joseph Rosasco, @properties Christie's Int'l R.E. Royal Oak. Realcomp II
