The house has been completely redone on the inside brand new cabinet ,new flooring, new windows new roof, new furnace, new air conditioner. Three bedrooms two, 2 car garage.
For sale by owner
Street View
Price cut: $5K (10/19)
$290,000
27858 El Capitan Dr, Warren, MI 48092
3beds
1,360sqft
SingleFamily
Built in 1966
7,840 Square Feet Lot
$-- Zestimate®
$213/sqft
$-- HOA
What's special
New roofNew air conditionerNew furnaceNew windowsThree bedroomsBrand new cabinetNew flooring
- 58 days
- 241
- 9
Listed by:
Property Owner (586) 438-9816
Facts & features
Interior
Bedrooms & bathrooms
- Bedrooms: 3
- Bathrooms: 2
- Full bathrooms: 1
- 1/2 bathrooms: 1
Heating
- Other, Gas
Cooling
- Central
Appliances
- Included: Dishwasher, Garbage disposal
Features
- Flooring: Linoleum / Vinyl
- Basement: Unfinished
- Has fireplace: Yes
Interior area
- Total interior livable area: 1,360 sqft
Property
Parking
- Total spaces: 2
- Parking features: Garage - Attached
Features
- Exterior features: Brick
Lot
- Size: 7,840 Square Feet
Details
- Parcel number: 121318429010
Construction
Type & style
- Home type: SingleFamily
Condition
- New construction: No
- Year built: 1966
Community & HOA
Location
- Region: Warren
Financial & listing details
- Price per square foot: $213/sqft
- Tax assessed value: $212,820
- Annual tax amount: $2,073
- Date on market: 8/28/2026
Estimated market value
Not available
Estimated sales range
Not available
$2,044/mo
Price history
| Date | Event | Price |
|---|---|---|
| 10/19/2026 | Price change | $290,000-1.7%$213/sqft |
Source: Owner Report a problem | ||
| 9/30/2026 | Price change | $295,000-6.3%$217/sqft |
Source: Owner Report a problem | ||
| 9/6/2026 | Price change | $315,000+6.8%$232/sqft |
Source: Owner Report a problem | ||
| 8/28/2026 | Listed for sale | $295,000$217/sqft |
Source: Owner Report a problem | ||
Public tax history
| Year | Property taxes | Tax assessment |
|---|---|---|
| 2026 | $2,073 -31.4% | $106,410 +57.1% |
| 2025 | $3,020 +5.3% | $67,750 -41.3% |
| 2024 | $2,868 +6.7% | $115,360 +21.7% |
| 2023 | $2,687 -20.4% | $94,770 +11.2% |
| 2022 | $3,377 +0.6% | $85,230 +5.5% |
| 2021 | $3,356 | $80,750 +6% |
| 2020 | $3,356 +6.9% | $76,200 +4.3% |
| 2019 | $3,139 +23.2% | $73,030 +7.6% |
| 2018 | $2,549 | $67,880 +12.1% |
| 2017 | -- | $60,570 |
| 2016 | -- | $60,570 +9.1% |
| 2015 | -- | $55,540 +21.2% |
| 2012 | -- | $45,820 |
| 2010 | -- | -- |
| 2009 | -- | $73,600 -14.1% |
| 2008 | -- | $85,680 -7.7% |
| 2007 | -- | $92,860 -0.1% |
| 2006 | -- | $92,960 +4.5% |
| 2005 | -- | $88,980 +2.9% |
| 2004 | -- | $86,460 +58.7% |
| 2001 | $2,237 +6.9% | $54,470 +3.2% |
| 2000 | $2,093 | $52,790 |
Find assessor info on the county website
Monthly payment
Est. payment
Payment breakdown
Explore the cost of this home by adjusting the details. Changes won't be saved.Climate risks
Neighborhood: 48092
Similar homes
- $--3 bd2 ba1.1k sqft4327 Linville Dr, Warren, MI 48092Auction
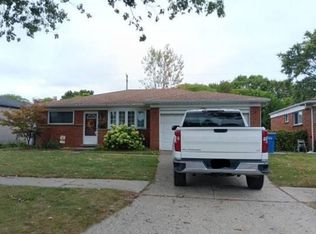 Xome
- $250,0003 bd2 ba1.8k sqft28111 Cunningham Dr, Warren, MI 48092For Sale

 MLS ID #50225614, Chandler Nash, Realteam Real Estate. MiRealSource
- $279,9003 bd2 ba1.4k sqft2652 Agustina Dr, Warren, MI 48091For Sale
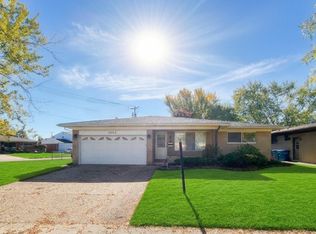
 MLS ID #20261034852, Albert J Barbera, Fortuna Realty LLC. Realcomp II
- $289,0003 bd2 ba1.6k sqft3615 Bicsak Dr, Warren, MI 48092For Sale
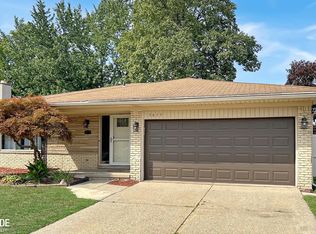 MLS ID #50220256, Gary Papak, Keller Williams Realty Lakeside. MiRealSource
- $249,9003 bd2 ba1.6k sqft4661 Gerald St, Warren, MI 48092For SaleMLS ID #50224957, Brandon Schmidt, Epique Inc.. MiRealSource
- $299,9004 bd2 ba1.9k sqft4728 Stilwell Dr, Warren, MI 48092For SaleMLS ID #20261083997, Sheikh Ali, Amin Realty. Realcomp II
- $289,9003 bd2 ba1.5k sqft26430 Joe Dr, Warren, MI 48091For SaleMLS ID #20261066780, Donny T Konja, 3Sixty5 Realty. Realcomp II
- $294,9995 bd2 ba1.9k sqft27116 Warner Ave, Warren, MI 48092For SaleMLS ID #20261071296, Ace A Sobh, Ace of Real Estate LLC. Realcomp II
- $290,0004 bd2 ba2k sqft30827 Scrivo Dr, Warren, MI 48092For SaleMLS ID #50220621, Mark Connon, RE/MAX First. MiRealSource
- $249,9003 bd2 ba1.7k sqft5674 Heathdale Ave, Warren, MI 48092For SaleMLS ID #20261084093, Mark Kattula, @properties Christie's Int'l R.E. Birmingham. Realcomp II
- $299,9004 bd3 ba1.7k sqft4427 Burssens Dr, Warren, MI 48092For SaleMLS ID #20261081937, Heidi Norris, Real Estate For A CAUSE. Realcomp II
- $225,0003 bd2 ba1.4k sqft4520 Buckingham Dr, Warren, MI 48092For SaleMLS ID #20261081152, Cooper Brown, RE/MAX Eclipse. Realcomp II
- $329,9003 bd2 ba1.9k sqft3848 Pall Dr, Warren, MI 48092For SaleMLS ID #20261075451, Polash Sanur, IKONIK REALTY. Realcomp II
- $239,9003 bd2 ba2k sqft4940 Stanley Ave, Warren, MI 48092For SaleMLS ID #20261077987, Ali Haider, Brookstone, Realtors LLC. Realcomp II
- $239,9003 bd1 ba1k sqft4701 Berwyn Dr, Warren, MI 48092For SaleMLS ID #20261084322, Mike Antias, Brookstone, Realtors LLC. Realcomp II
- $285,0003 bd2 ba1.5k sqft28282 Couzens Ave, Madison Heights, MI 48071For SaleMLS ID #20261076141, Christina Joss, Golden Path Real Estate Co. Realcomp II
- $240,0003 bd2 ba1.6k sqft4806 Holmes Dr, Warren, MI 48092For SaleMLS ID #20261073946, Jeff Todd, Keller Williams Paint Creek. Realcomp II
- $269,9993 bd2 ba1.1k sqft1640 Nottingham Dr, Madison Heights, MI 48071For SaleMLS ID #20261067030, Angelica Pearson, eXp Realty Best Life and Company. Realcomp II
