CURRENT RENT = $2,000/mo. Strong multifamily investment opportunity with $2,000/mo income. Long term tenants have been in the home for almost 10 years. Fully brick duplex with two 2-bedroom 1-bath units. Units have identical layouts. Large open living area. Lots of natural light. Professionally managed rental property. In order to protect the quiet enjoyment of the residents, physical inspections will be granted upon an accepted offer. We appreciate your discretion—please do not approach the property.
For sale
Price cut: $5.1K (10/23)
$189,900
28215 Cherry St, Inkster, MI 48141
4beds
2,068sqft
Duplex
Built in 1961
-- sqft lot
$185,500 Zestimate®
$92/sqft
$-- HOA
What's special
- 43 days
- 315
- 24
Zillow last checked:
Listing updated:
Listed by:
Joseph Hammel 248-422-1685,
Keller Williams Somerset 248-649-7200,
Matthew Bahoura 248-201-7342,
Keller Williams Paint Creek
Source: Realcomp II,MLS#: 20261076202
Facts & features
Interior
Bedrooms & bathrooms
- Bedrooms: 4
- Bathrooms: 2
- Full bathrooms: 2
Heating
- Forced Air, Natural Gas
Features
- Basement: Unfinished
- Has fireplace: No
Interior area
- Total interior livable area: 2,068 sqft
- Finished area above ground: 2,068
Property
Features
- Levels: Two
- Stories: 2
- Pool features: None
Lot
- Size: 6,098 Square Feet
- Dimensions: 56.69 x 110
Details
- Parcel number: 44010010092000
- Zoning description: MultiFamily
- Special conditions: Short Sale No,Standard
Construction
Type & style
- Home type: MultiFamily
- Architectural style: Duplex
- Property subtype: Duplex
Materials
- Brick
- Foundation: Basement, Block
Condition
- New construction: No
- Year built: 1961
Utilities & green energy
- Sewer: Public Sewer
- Water: Public
Community & HOA
Community
- Subdivision: WEST DEARBORN SUB
Location
- Region: Inkster
Financial & listing details
- Price per square foot: $92/sqft
- Tax assessed value: $74,900
- Annual tax amount: $2,768
- Date on market: 9/28/2026
- Cumulative days on market: 43 days
- Listing agreement: Exclusive Right To Sell
- Listing terms: Cash,Conventional
- Exclusions: Exclusion(s) Do Not Exist
Estimated market value
$185,500
$176,000 - $195,000
$1,370/mo
Price history
| Date | Event | Price |
|---|---|---|
| 10/23/2026 | Price change | $189,900-2.6%$92/sqft |
Source:  Realcomp II #20261076202 Report a problem | ||
| 9/28/2026 | Listed for sale | $195,000+34.5%$94/sqft |
Source: Realcomp II #20261076202 Report a problem | ||
| 3/5/2025 | Sold | $145,000-3.3%$70/sqft |
Source: Public Record Report a problem | ||
| 12/11/2024 | Price change | $149,900-3.6%$72/sqft |
Source:  MichRIC #24051364 Report a problem | ||
| 10/1/2024 | Listed for sale | $155,500+154.9%$75/sqft |
Source: MichRIC #24051364 Report a problem | ||
| 10/29/2020 | Sold | $61,000-6%$29/sqft |
Source: Public Record Report a problem | ||
| 8/4/2020 | Pending sale | $64,900$31/sqft |
Source: Century 21 Curran & Oberski #2200005158 Report a problem | ||
| 7/13/2020 | Price change | $64,900-5.8%$31/sqft |
Source: Century 21 Curran & Oberski #2200005158 Report a problem | ||
| 5/19/2020 | Listed for sale | $68,900$33/sqft |
Source: Century 21 Curran & Oberski #2200005158 Report a problem | ||
| 5/12/2020 | Pending sale | $68,900$33/sqft |
Source: CENTURY 21 Curran & Oberski #2200005158 Report a problem | ||
| 4/8/2020 | Price change | $68,900-1.4%$33/sqft |
Source: CENTURY 21 Curran & Oberski #2200005158 Report a problem | ||
| 1/21/2020 | Listed for sale | $69,900+20.5%$34/sqft |
Source: Century 21 Curran & Oberski #2200005158 Report a problem | ||
| 10/16/2019 | Sold | $58,000-10.8%$28/sqft |
Source: Public Record Report a problem | ||
| 9/18/2019 | Pending sale | $65,000$31/sqft |
Source: ERA Reardon Realty #219037844 Report a problem | ||
| 4/26/2019 | Listed for sale | $65,000$31/sqft |
Source: ERA Reardon Realty #219037844 Report a problem | ||
Public tax history
| Year | Property taxes | Tax assessment |
|---|---|---|
| 2025 | -- | $63,100 +66.9% |
| 2024 | -- | $37,800 +20.8% |
| 2023 | -- | $31,300 +9.8% |
| 2022 | -- | $28,500 +13.5% |
| 2021 | -- | $25,100 |
| 2020 | $2,977 +97% | $25,100 +9.1% |
| 2019 | $1,511 | $23,000 +19.2% |
| 2018 | $1,511 | $19,300 +11.6% |
| 2017 | -- | $17,300 +10.2% |
| 2016 | $2,435 | $15,700 -39.4% |
| 2015 | $2,435 -33.1% | $25,900 -28.8% |
| 2013 | $3,640 +49.5% | $36,400 -11.9% |
| 2012 | $2,435 | $41,300 -20.3% |
| 2010 | -- | $51,800 -7.2% |
| 2009 | -- | $55,800 -16.6% |
| 2008 | -- | $66,900 |
| 2007 | -- | $66,900 +13.4% |
| 2005 | $1,734 | $59,000 +7.1% |
| 2003 | -- | $55,100 +64.8% |
| 2001 | $2,493 +4.7% | $33,444 +3.2% |
| 2000 | $2,382 | $32,407 |
Find assessor info on the county website
Monthly payment
Est. payment
Payment breakdown
Explore the cost of this home by adjusting the details. Changes won't be saved.Climate risks
Neighborhood: 48141
Similar homes
- $124,0003 bd2 ba2.2k sqft3752 Williams St, Inkster, MI 48141For Sale

 MLS ID #20261067854, Peggy Bishop-Lucas, Murray's Real Estate Services. Realcomp II
- $200,0003 bd2 ba1.6k sqft14100 Rockland St W, Redford, MI 48239For Sale
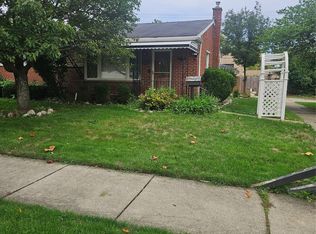 MLS ID #20261076947, Cynthia M Johnson, Brass Titan LLC. Realcomp II
- $190,0004 bd2 ba2.7k sqft8676 Schaefer Hwy, Detroit, MI 48228For Sale
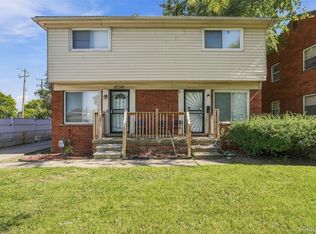 MLS ID #20261078299, Brittney Dickerson, EXP Realty Main. Realcomp II
- $119,9002 bd1 ba1.1k sqft1060 Eastwood St, Inkster, MI 48141For Sale
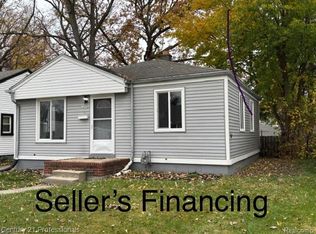 MLS ID #20261089171, Donald G Castelli, Century 21 Professionals Clarkston. Realcomp II
- $199,9003 bd2 ba1.8k sqft830 S Venoy Rd, Westland, MI 48186For SaleMLS ID #20261046815, Deborah J Black, Pro Realty. Realcomp II
- $184,9996 bd2 ba1.9k sqft6643 Barlum St, Detroit, MI 48210For SaleMLS ID #20261080610, Roberto Ortiz, Las Casas Real Estate LLC. Realcomp II
- $179,9003 bd1 ba1.1k sqft6475 N Highland St, Dearborn Heights, MI 48127For SaleMLS ID #20261088324, Abir El Cheikh Ali, ARG Realty. Realcomp II
- $179,9004 bd2 ba2.4k sqft17195-17197 Stoepel St, Detroit, MI 48221For SaleMLS ID #20261051892, Ronald Simpson, 21st Century Elegant Homes. Realcomp II
- $166,9003 bd2 ba1k sqft35244 Michelle Dr, Romulus, MI 48174For SaleMLS ID #20261085856, Tim Muflihi, RE/MAX Team 2000. Realcomp II
- $197,5003 bd2 ba1.4k sqft7597 Ziegler St, Taylor, MI 48180For Sale
 MLS ID #26052485, Stacey St. Clair, Vantage Realty Group, LLC. MichRIC
- $159,9003 bd2 ba2.2k sqft17691 Avon Ave, Detroit, MI 48219For SaleMLS ID #20261089414, Hassan Scheib, Own It Realty. Realcomp II
- $160,0004 bd3 ba2k sqft13564 Northlawn St, Detroit, MI 48238For SaleMLS ID #20261088327, Michael Gerisch, Century 21 Curran & Oberski. Realcomp II
- $219,9003 bd2 ba2.1k sqft11791 Columbia, Redford, MI 48239For SaleMLS ID #20261083342, Carolina Drury, Century 21 Professionals Livonia. Realcomp II
- $99,9003 bd1 ba1k sqft1014 Arlington St, Inkster, MI 48141For SaleMLS ID #20261044468, Mike Dominick, Golden Path Real Estate Co. Realcomp II
- $210,0005 bd3 ba2.8k sqft13340 Hartwell St, Detroit, MI 48227For SaleMLS ID #20261078925, Ligia M Godoy, CMB Real Estate. Realcomp II
- $214,9002 bd2 ba1.1k sqft13 Canfield Cir, Dearborn Heights, MI 48127For SaleMLS ID #26053021, Ernestine Williams, Will Cooperate Realty LLC. MichRIC
- $205,0003 bd2 ba1.7k sqft18254 Jamestown Cir, Northville, MI 48168For SaleMLS ID #20261090015, Steve Koleno, Beycome Brokerage Realty LLC. Realcomp II
- $229,9003 bd2 ba2.1k sqft6270 Hunt St, Romulus, MI 48174For SaleMLS ID #20261058059, Mike Shannon, Metropolitan Real Estate. Realcomp II
- $229,0004 bd2 ba1.6k sqft810 Young St, Ypsilanti, MI 48198For SaleMLS ID #26034057, Michael Slater, Beal Properties LLC. MichRIC
- $187,5002 bd1 ba1.9k sqft23409 Ranch Hill Dr W, Southfield, MI 48033For SaleMLS ID #20261054236, Marsha V Cohen, Community Choice Realty Inc. Realcomp II
