INVESTORS. FLIPPERS. DEVELOPERS. FHA203K REHAB BUYERS. Amazing property in one of Boston's hottest neighborhoods priced to sell just in time for the holidays! Located two blocks from Boston Landing and two blocks from N. Beacon Street in Allston, this property needs your vision to rehab and restore it inside and out. Area approvals include abutter to converting its single family into a 3F dwelling. This property has a large fenced in yard. Walking distance to Penniman Road Play Area, Stop & Shop, Needham Bank, and Tenacity. Property is occupied. Do not walk property without appointment. This house will not qualify for conventional financing.
For sale
$699,900
30 Blaine St, Allston, MA 02134
5beds
1,356sqft
Single Family Residence
Built in 1889
1,135 Square Feet Lot
$689,800 Zestimate®
$516/sqft
$-- HOA
What's special
Large fenced in yard
- 13 days
- 697
- 20
Zillow last checked:
Listing updated:
Listed by:
Linda G. Champion 617-877-0363,
CUE Realty 617-989-9316
Source: MLS PIN,MLS#: 73587377
Facts & features
Interior
Bedrooms & bathrooms
- Bedrooms: 5
- Bathrooms: 3
- Full bathrooms: 2
- 1/2 bathrooms: 1
Heating
- Forced Air
Cooling
- None
Appliances
- Included: Gas Water Heater
Features
- Basement: Full
- Has fireplace: No
Interior area
- Total structure area: 1,356
- Total interior livable area: 1,356 sqft
- Finished area above ground: 1,356
Property
Parking
- Total spaces: 1
- Uncovered spaces: 1
Features
- Fencing: Fenced/Enclosed
Lot
- Size: 1,135 Square Feet
Details
- Parcel number: W:22 P:01714 S:000,1206788
- Zoning: R1
Construction
Type & style
- Home type: SingleFamily
- Architectural style: Colonial
- Property subtype: Single Family Residence
Materials
- Foundation: Stone
Condition
- Year built: 1889
Utilities & green energy
- Sewer: Public Sewer
- Water: Public
Community & HOA
Community
- Features: Public Transportation, Highway Access, House of Worship, Public School
HOA
- Has HOA: No
Location
- Region: Allston
Financial & listing details
- Price per square foot: $516/sqft
- Tax assessed value: $733,200
- Annual tax amount: $9,092
- Date on market: 10/6/2026
Estimated market value
$689,800
$655,000 - $724,000
$8,043/mo
Price history
| Date | Event | Price |
|---|---|---|
| 10/6/2026 | Listed for sale | $699,900+159.2%$516/sqft |
Source: MLS PIN #73587377 Report a problem | ||
| 3/8/2001 | Sold | $270,000+22.7%$199/sqft |
Source: Public Record Report a problem | ||
| 3/1/2000 | Sold | $220,000+109.5%$162/sqft |
Source: Public Record Report a problem | ||
| 8/15/1996 | Sold | $105,000$77/sqft |
Source: Public Record Report a problem | ||
Public tax history
| Year | Property taxes | Tax assessment |
|---|---|---|
| 2025 | $8,011 +19.1% | $691,800 +12.1% |
| 2024 | $6,724 +1.5% | $616,900 |
| 2023 | $6,626 +1.7% | $616,900 +3% |
| 2022 | $6,515 +10.2% | $598,800 +8.1% |
| 2021 | $5,911 +25% | $554,000 +23.8% |
| 2020 | $4,727 +8.2% | $447,600 +8% |
| 2019 | $4,369 +3.6% | $414,500 +3% |
| 2018 | $4,218 +676.7% | $402,500 +1.1% |
| 2017 | $543 -86.9% | $398,300 +6% |
| 2016 | $4,134 +7.7% | $375,800 +18.5% |
| 2015 | $3,839 -0.3% | $317,000 +8.2% |
| 2013 | $3,850 -5.8% | $293,000 -6.5% |
| 2012 | $4,087 +2% | $313,400 |
| 2011 | $4,008 +6.6% | $313,400 -1% |
| 2010 | $3,760 +2.7% | $316,500 -8.1% |
| 2009 | $3,661 -4.6% | $344,400 -1.5% |
| 2008 | $3,837 -7.6% | $349,800 -7.4% |
| 2007 | $4,153 | $377,900 |
Find assessor info on the county website
Monthly payment
Est. payment
Payment breakdown
Explore the cost of this home by adjusting the details. Changes won't be saved.Climate risks
Neighborhood: Allston

Similar homes
- $450,0002 bd2 ba1.1k sqft11 Gordon St, Allston, MA 02134For Sale
 MLS ID #73592136, Norman O'Grady, RE/MAX On the Charles. MLS PIN
- $699,0003 bd2 ba1.3k sqft32 Aldrich St, Roslindale, MA 02131For Sale
 MLS ID #73587792, Kate Duggan, Bostonia Properties. MLS PIN
- $599,0003 bd1 ba1.2k sqft16 Glenville Ave APT 1, Allston, MA 02134For Sale
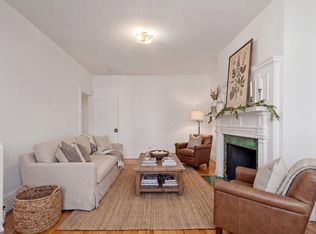 MLS ID #73580275, Zachary Friedman, Compass. MLS PIN
- $--2 bd1 ba844 sqft215 Stimson St, West Roxbury, MA 02132Auction
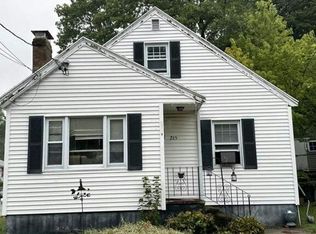 Auction.com 2
