well-maintained single-family home offering comfortable living space. Features natural gas heating, public sewer. currently tenant-occupied and being sold with tenant in place. showings by appointment only. contact the listing agent to schedule. w
For sale
$309,000
320 East Avenue, Bridgeport, CT 06610
3beds
1,262sqft
Single Family Residence
Built in 1917
2,613 Square Feet Lot
$301,400 Zestimate®
$245/sqft
$-- HOA
What's special
Comfortable living spaceNatural gas heating
- 5 days
- 88
- 0
Zillow last checked:
Listing updated:
Listed by:
JB B. Pereira (203)710-6066,
Premium Realty, LLC 203-615-4766
Source: Smart MLS,MLS#: 24218161
Facts & features
Interior
Bedrooms & bathrooms
- Bedrooms: 3
- Bathrooms: 2
- Full bathrooms: 1
- 1/2 bathrooms: 1
Primary bedroom
- Level: Main
Bedroom
- Level: Main
Bedroom
- Level: Main
Living room
- Level: Main
Heating
- Forced Air, Natural Gas
Cooling
- None
Appliances
- Included: Oven/Range, Refrigerator, Water Heater
Features
- Basement: Full
- Attic: None
- Has fireplace: No
Interior area
- Total structure area: 1,262
- Total interior livable area: 1,262 sqft
- Finished area above ground: 1,262
Property
Lot
- Size: 2,613 Square Feet
- Features: Level
Details
- Parcel number: 999999999
- Zoning: residential
Construction
Type & style
- Home type: SingleFamily
- Architectural style: Colonial
- Property subtype: Single Family Residence
Materials
- Brick
- Foundation: Block
- Roof: Asphalt
Condition
- New construction: No
- Year built: 1917
Utilities & green energy
- Sewer: Public Sewer
- Water: Public
Community & HOA
Community
- Subdivision: Mill Hill
HOA
- Has HOA: No
Location
- Region: Bridgeport
Financial & listing details
- Price per square foot: $245/sqft
- Tax assessed value: $107,504
- Annual tax amount: $4,671
- Date on market: 10/30/2026
Estimated market value
$301,400
$286,000 - $316,000
$2,775/mo
Price history
| Date | Event | Price |
|---|---|---|
| 10/30/2026 | Listed for sale | $309,000+239.6%$245/sqft |
Source:  Smart MLS #24218161 Report a problem | ||
| 11/1/2023 | Listing removed | -- |
Source: Zillow Rentals Report a problem | ||
| 10/28/2023 | Listed for rent | $2,200$2/sqft |
Source: Zillow Rentals Report a problem | ||
| 4/4/2019 | Sold | $91,000+82%$72/sqft |
Source: Smart MLS #170166168 Report a problem | ||
| 1/26/2016 | Sold | $50,000-16.7%$40/sqft |
Source: Smart MLS #99126156 Report a problem | ||
| 11/13/2015 | Listed for sale | $60,000-28.4%$48/sqft |
Source: RE/MAX Right Choice Real Estate #99126156 Report a problem | ||
| 2/28/2003 | Sold | $83,800$66/sqft |
Source: Smart MLS #98140218 Report a problem | ||
Public tax history
| Year | Property taxes | Tax assessment |
|---|---|---|
| 2025 | $4,671 | $107,504 |
| 2024 | $4,671 | $107,504 |
| 2023 | $4,671 | $107,504 |
| 2022 | $4,671 | $107,504 |
| 2021 | $4,671 +37.1% | $107,504 +70.4% |
| 2020 | $3,406 | $63,080 |
| 2019 | $3,406 -0.7% | $63,080 |
| 2018 | $3,430 | $63,080 |
| 2017 | $3,430 | $63,080 |
| 2016 | $3,430 -6% | $63,080 -27% |
| 2015 | $3,648 | $86,440 |
| 2014 | $3,648 +0.8% | $86,440 |
| 2013 | $3,618 +1.8% | $86,440 |
| 2012 | $3,554 +3.7% | $86,440 |
| 2011 | $3,426 | $86,440 |
| 2010 | $3,426 +2.3% | $86,440 |
| 2009 | $3,349 +7.7% | $86,440 +23.9% |
| 2008 | $3,111 +3.9% | $69,790 |
| 2007 | $2,993 +1.4% | $69,790 |
| 2006 | $2,951 +8.5% | $69,790 |
| 2004 | $2,721 +0.6% | $69,790 +42.4% |
| 2003 | $2,705 -15.1% | $49,000 |
| 2001 | $3,185 +48% | $49,000 +48% |
| 2000 | $2,152 -0.3% | $33,110 -0.3% |
| 1999 | $2,158 | $33,200 |
Find assessor info on the county website
Monthly payment
Est. payment
Payment breakdown
Explore the cost of this home by adjusting the details. Changes won't be saved.Climate risks
Neighborhood: Downtown
Similar homes
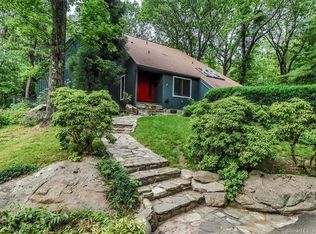
- $320,0003 bd2 ba1.3k sqft361 Linnmoore Street, Hartford, CT 06106For Sale
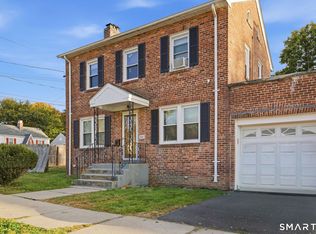
 MLS ID #24218281, Lesbia M. Hernandez, Five Stars Realty. Smart MLS
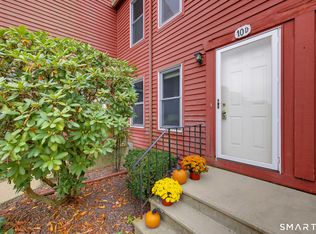
- $379,9005 bd3 ba1.8k sqft17 Keney Terrace, Hartford, CT 06112For Sale
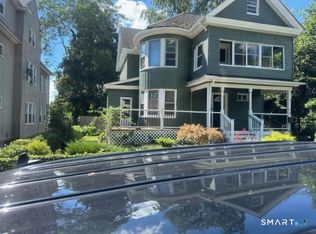 MLS ID #24205435, Lucy Biondi, KDR Real Estate LLC. Smart MLS
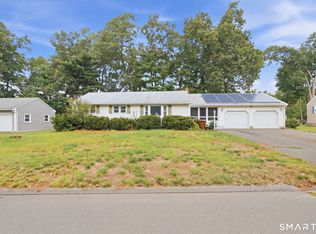
- $319,0003 bd2 ba1.6k sqft110 Plainfield Street, Hartford, CT 06112For Sale
 MLS ID #24211407, Christian Flores, mygoodagent. Smart MLS
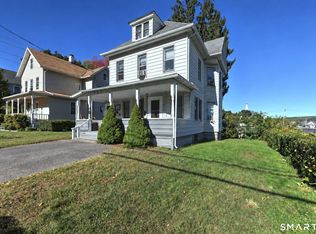
- $349,9003 bd2 ba1.6k sqft163 Manchester Street, Hartford, CT 06112For Sale
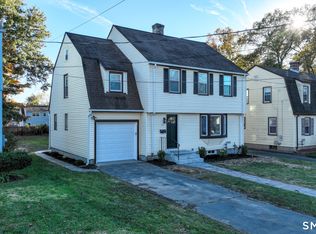 MLS ID #24217305, Luke Florian, SSG Real Estate LLC. Smart MLS
- $320,0003 bd2 ba1.4k sqft11 Brewer Street, East Hartford, CT 06118For SaleMLS ID #24214955, Christopher Ragsdale, Thomas Real Estate. Smart MLS
- $299,9003 bd1 ba960 sqft507 Halfway House Road, Windsor Locks, CT 06096For SaleMLS ID #24217593, David Merrigan, Merrigan & Lefebvre Realty. Smart MLS
- $310,0003 bd1 ba1.2k sqft103 West Center Street, Manchester, CT 06040For SaleMLS ID #24216202, Holly A. Keating, Agnelli Real Estate. Smart MLS
- $289,9003 bd1 ba1.1k sqft85 Brookline Avenue, Bloomfield, CT 06002For SaleMLS ID #24207980, Jasmin Vazquez, RE/MAX One. Smart MLS
- $275,0003 bd2 ba1.2k sqft110 Matianuck Avenue, Windsor, CT 06095For SaleMLS ID #24210521, Kristel Bolden-Gray, eXp Realty. Smart MLS
- $314,9003 bd1 ba1.3k sqft9 Burr Avenue, Middletown, CT 06457For SaleMLS ID #24216947, Gissett Espinal, The Property Shop CT. Smart MLS
- $399,9993 bd2 ba1.5k sqft850 Tower Avenue, Hartford, CT 06112For SaleMLS ID #24215879, Raymond L. Malcolm, Cornerstone Homes Plus, Inc.. Smart MLS
- $179,9003 bd2 ba1.2k sqft295 Goodwin Street, East Hartford, CT 06108For SaleMLS ID #24216738, Carla A. Neary-Bellizzi, Coldwell Banker Realty. Smart MLS
- $299,9003 bd1 ba1.4k sqft342 Old Main Street, Rocky Hill, CT 06067For SaleMLS ID #24207282, Tanya Uhelsky, Century 21 AllPoints Realty. Smart MLS
- $310,0003 bd1 ba1.4k sqft39 Ardmore Road, Manchester, CT 06040For SaleMLS ID #24215217, Mary C. Ingalls, Mary Ingalls Real Estate. Smart MLS
- $345,0003 bd2 ba1.1k sqft1841 Main Street, East Hartford, CT 06108For SaleMLS ID #24198283, Daniel Alvarado, Better Homes and Gardens Real Estate Executive Real Estate. Smart MLS
- $334,9003 bd1 ba960 sqft73 Janet Drive, East Hartford, CT 06118For SaleMLS ID #24210514, Yomayra Soto, Key Connection Realty, LLC. Smart MLS
- $269,9003 bd2 ba1.2k sqft33 Hilton Drive, East Hartford, CT 06118For SaleMLS ID #24212130, Michael J. Johnson, Lock and Key Realty, Inc. Smart MLS
- $355,0004 bd2 ba1.4k sqft55 Glendale Avenue, Hartford, CT 06106For SaleMLS ID #24186206, Peter SN D'addeo, Commercial Services Realty. Smart MLS
