Excellent investment opportunity! This four-unit multifamily property features three 2-bedroom units and one 3-bedroom unit, currently generating $3,670 in monthly rental income ($44,040 annually). Tenants are responsible for their own utilities, helping minimize owner operating expenses. This income producing property offers an opportunity for investors looking to expand their rental portfolio. Property is being sold as part of a package with 13011 E 8th Street and 4541 Lister Avenue for a total of 9 units for 790k (87k a door). Great opportunity to acquire multiple investment properties in one transaction. Contact the listing agent for additional information, rental details, and showing instructions.
Active
$360,000
3339 Indiana Ave, Kansas City, MO 64128
--beds
1baths
--sqft
Quadruplex
Built in 1937
-- sqft lot
$-- Zestimate®
$--/sqft
$-- HOA
What's special
- 16 days
- 99
- 14
Zillow last checked:
Listing updated:
Listed by:
Ashley Wilson 909-645-4339,
1st Class Real Estate KC
Source: Heartland MLS as distributed by MLS GRID,MLS#: 2649841
Facts & features
Interior
Bedrooms & bathrooms
- Bathrooms: 1
Heating
- Forced Air
Cooling
- Electric
Appliances
- Included: Refrigerator, Electric Range, Stainless Steel Appliance(s), Ind Water Heaters
- Laundry: Inside
Features
- Has basement: Yes
Property
Parking
- Parking features: Off Street, On Street
- Has uncovered spaces: Yes
Features
- Patio & porch: Deck- Covered, Covered
Lot
- Size: 5,828 Square Feet
Details
- Parcel number: 28940191100000000
- Zoning: MF
Construction
Type & style
- Home type: MultiFamily
- Property subtype: Quadruplex
Materials
- Brick/Mortar, Wood Siding
- Roof: Synthetic
Condition
- Year built: 1937
Utilities & green energy
- Sewer: Public Sewer
- Water: Public
- Utilities for property: Ind Heat And Air, Separate Meters
Community & HOA
Community
- Subdivision: Conrad & Mixon's Addition
HOA
- Has HOA: No
Location
- Region: Kansas City
Financial & listing details
- Tax assessed value: $116,380
- Annual tax amount: $1,855
- Date on market: 11/1/2026
- Listing terms: Cash,Conventional,FHA,VA Loan
Estimated market value
Not available
Estimated sales range
Not available
Not available
Price history
| Date | Event | Price |
|---|---|---|
| 11/1/2026 | Listed for sale | $360,000+20% |
Source:  Heartland MLS as distributed by MLS GRID #2649841 Report a problem | ||
| 7/23/2024 | Sold | -- |
Source: Heartland MLS as distributed by MLS GRID #2477969 Report a problem | ||
| 6/26/2024 | Pending sale | $300,000 |
Source: Heartland MLS as distributed by MLS GRID #2477969 Report a problem | ||
| 6/8/2024 | Contingent | $300,000 |
Source: Heartland MLS as distributed by MLS GRID #2477969 Report a problem | ||
| 5/21/2024 | Price change | $300,000-7.7% |
Source: Heartland MLS as distributed by MLS GRID #2477969 Report a problem | ||
| 3/16/2024 | Listed for sale | $325,000 |
Source: Heartland MLS as distributed by MLS GRID #2477969 Report a problem | ||
Public tax history
| Year | Property taxes | Tax assessment |
|---|---|---|
| 2025 | $1,855 -30.9% | $22,112 -35% |
| 2024 | $2,686 +1% | $34,031 |
| 2023 | $2,661 +93.4% | $34,031 +103.5% |
| 2022 | $1,375 +0.3% | $16,721 |
| 2021 | $1,371 +12.4% | $16,721 +13.8% |
| 2020 | $1,220 +2.1% | $14,695 |
| 2019 | $1,194 | $14,695 -9% |
| 2018 | $1,194 -10.8% | $16,150 +214.1% |
| 2017 | $1,340 +301.3% | $5,142 +23% |
| 2016 | $334 -62.6% | $4,180 |
| 2014 | $892 +163.4% | $4,180 |
| 2013 | $339 +0.5% | $4,180 |
| 2012 | $337 +0.1% | $4,180 |
| 2011 | $337 +0.9% | $4,180 |
| 2010 | $334 -54.1% | $4,180 -36% |
| 2009 | $727 +0.5% | $6,535 -28.8% |
| 2008 | $723 +13.9% | $9,177 |
| 2007 | $635 +0% | $9,177 +15% |
| 2006 | $635 +1.5% | $7,980 |
| 2005 | $625 +0.1% | $7,980 |
| 2004 | $625 +3.8% | $7,980 |
| 2003 | $602 +0.3% | $7,980 +5% |
| 2002 | $600 -0.3% | $7,600 |
| 2001 | $602 | $7,600 |
Find assessor info on the county website
Monthly payment
Est. payment
Payment breakdown
Explore the cost of this home by adjusting the details. Changes won't be saved.Climate risks
Neighborhood: Palestine West and Oak Park Northeast


Similar homes
- $380,000-- bd4 ba-- sqft3327-3329 Indiana Ave, Kansas City, MO 64128For Sale
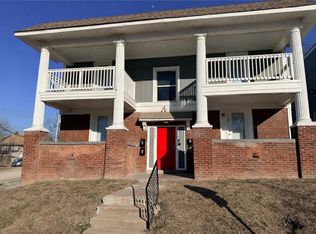 MLS ID #2644156, Marline Brown, Murrell Homes Real Estate Grp. Heartland MLS as distributed by MLS GRID
- $375,0008 bd4 ba3k sqft4105 E Linwood Blvd, Kansas City, MO 64128For Sale
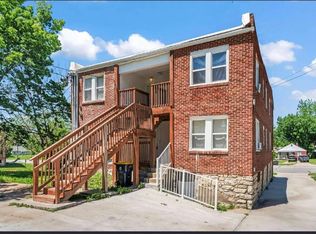 MLS ID #2642940, Blythe Roberts, Advance Realty Group LLC. Heartland MLS as distributed by MLS GRID
- $240,000-- bd-- ba-- sqft3315 Indiana Ave, Kansas City, MO 64128For Sale
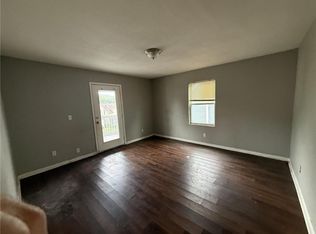 MLS ID #2651406, Executive Asset Properties Group, Keller Williams Realty Partners Inc.. Heartland MLS as distributed by MLS GRID
- $--4 bd3 ba2.6k sqft2942 E 29th St, Kansas City, MO 64128Auction
 ServiceLink Auction
