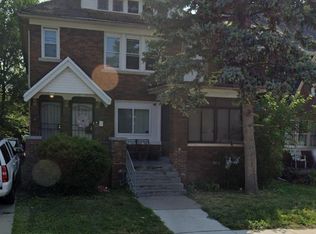
Great opportunity and location! Plenty of square footage for each unit - 3436 and 3438 Bedford St! 3-bedrooms, 1-bathroom, dining room and separate kitchen and nook in each unit. Property is well maintained and includes new windows (2024), roof (2020), gutters, two furnaces and two hot water tanks. All utilities are individually metered. Potential rent at over $2,400/month!
For sale
$185,000
3436 Bedford St, Detroit, MI 48224
6beds
2,800sqft
Multi Family
Built in 1930
-- sqft lot
$185,900 Zestimate®
$66/sqft
$-- HOA
What's special
- 17 days
- 816
- 90
Zillow last checked:
Listing updated:
Listed by:
William A Calunas 586-206-5553,
Brookstone, Realtors LLC 248-963-0505
Source: Realcomp II,MLS#: 20261087946
Facts & features
Interior
Bedrooms & bathrooms
- Bedrooms: 6
- Bathrooms: 2
- Full bathrooms: 2
Heating
- Forced Air, Natural Gas
Cooling
- Ceiling Fans
Features
- Basement: Unfinished
- Has fireplace: No
Interior area
- Total interior livable area: 2,800 sqft
- Finished area above ground: 2,800
Property
Features
- Levels: Two
- Stories: 2
- Patio & porch: Porch
- Exterior features: Lighting
- Pool features: None
Lot
- Size: 4,791 Square Feet
- Dimensions: 40 x 122
Details
- Parcel number: W21I070702S
- Zoning description: MultiFamily, Residential
- Special conditions: Short Sale No,Standard
Construction
Type & style
- Home type: MultiFamily
- Architectural style: Colonial
- Property subtype: Multi Family
Materials
- Brick
- Foundation: Basement, Block
- Roof: Asphalt
Condition
- New construction: No
- Year built: 1930
Utilities & green energy
- Sewer: Public Sewer
- Water: Public
Community & HOA
Community
- Features: Sidewalks
- Subdivision: EAST DETROIT DEV COS 1
Location
- Region: Detroit
Financial & listing details
- Price per square foot: $66/sqft
- Tax assessed value: $20,236
- Annual tax amount: $3,969
- Date on market: 10/30/2026
- Cumulative days on market: 18 days
- Listing agreement: Exclusive Right To Sell
- Listing terms: Cash,Conventional
Estimated market value
$185,900
$177,000 - $195,000
$1,742/mo
Price history
| Date | Event | Price |
|---|---|---|
| 10/30/2026 | Listed for sale | $185,000+12.1%$66/sqft |
Source:  Realcomp II #20261087946 Report a problem | ||
| 10/20/2025 | Listing removed | $165,000$59/sqft |
Source:  MiRealSource #50190888 Report a problem | ||
| 10/8/2025 | Listed for sale | $165,000+267.5%$59/sqft |
Source: MiRealSource #50190888 Report a problem | ||
| 4/12/2013 | Listing removed | $44,900$16/sqft |
Source: NC DEVELOPMENT GROUP LLC #20014184 Report a problem | ||
| 3/21/2012 | Listing removed | $500 |
Source: NC Development Group Inc Report a problem | ||
| 3/21/2012 | Listed for sale | $44,900+541.4%$16/sqft |
Source: NC DEVELOPMENT GROUP LLC #20014184 Report a problem | ||
| 2/14/2012 | Price change | $500-13.8% |
Source: NC Development Group Inc Report a problem | ||
| 11/4/2011 | Price change | $580-3.3% |
Source: NC Development Group Inc Report a problem | ||
| 6/17/2011 | Listed for rent | $600 |
Source: NC Development Group Inc Report a problem | ||
| 11/7/2008 | Sold | $7,000-94%$3/sqft |
Source: MiRealSource #13310 Report a problem | ||
| 3/18/2008 | Sold | $117,198-2.3%$42/sqft |
Source: Public Record Report a problem | ||
| 5/11/2000 | Sold | $120,000$43/sqft |
Source: Public Record Report a problem | ||
Public tax history
| Year | Property taxes | Tax assessment |
|---|---|---|
| 2026 | -- | $116,300 +27.9% |
| 2025 | -- | $90,900 +52.3% |
| 2024 | -- | $59,700 +29.2% |
| 2023 | -- | $46,200 +23.9% |
| 2022 | -- | $37,300 +11.3% |
| 2021 | -- | $33,500 |
| 2020 | $2,629 +53.6% | $33,500 +19.6% |
| 2019 | $1,712 | $28,000 +15.7% |
| 2018 | $1,712 | $24,200 +3.9% |
| 2017 | -- | $23,300 +28.7% |
| 2016 | $2,736 | $18,100 |
| 2015 | $2,736 +11.9% | $18,100 -26% |
| 2013 | $2,446 -10.6% | $24,458 -31.8% |
| 2010 | $2,736 | $35,859 -18% |
| 2009 | -- | $43,731 -13% |
| 2008 | -- | $50,265 |
| 2007 | -- | $50,265 +5.5% |
| 2005 | $578 | $47,645 +3% |
| 2004 | -- | $46,257 +6% |
| 2001 | $2,841 +137.4% | $43,650 +118.3% |
| 2000 | $1,197 | $20,000 |
Find assessor info on the county website
Monthly payment
Est. payment
Payment breakdown
Explore the cost of this home by adjusting the details. Changes won't be saved.Climate risks
Neighborhood: Morningside


Similar homes
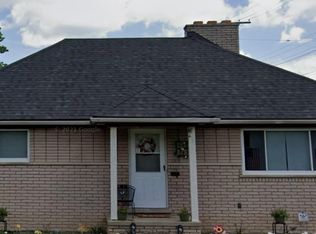
- $165,0003 bd2 ba2k sqft3640 Devonshire Rd, Detroit, MI 48224For Sale

 MLS ID #20261080042, Corey McCray, Real Broker, LLC. Realcomp II
- $149,9994 bd3 ba4k sqft4618 Chatsworth St, Detroit, MI 48224For Sale
 MLS ID #20261067210, Donald Moore Jr, Community Choice Realty Associates, LLC. Realcomp II
- $145,9003 bd2 ba1.7k sqft5545 Bedford St, Detroit, MI 48224For Sale
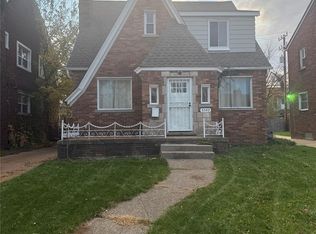 MLS ID #20261092285, Albert Hakim, RE/MAX First. Realcomp II
- $225,0003 bd2 ba1.6k sqft3914 Balfour Rd, Detroit, MI 48224For Sale
 MLS ID #20261072798, Tia Davis, Community Choice Realty Inc. Realcomp II
- $149,9993 bd2 ba1.6k sqft4175 Beaconsfield St, Detroit, MI 48224For SaleMLS ID #20261057887, Roland C Walker III, KW Grosse Pointe. Realcomp II
- $164,9954 bd2 ba1.7k sqft12160 Whitehill St, Detroit, MI 48224For SaleMLS ID #20261074470, Cornelius Wilson, Five Star Luxury Realty. Realcomp II
- $120,9004 bd3 ba3.9k sqft15231 Evanston St, Detroit, MI 48224For SaleMLS ID #20261067778, Sandra E Johnson, Archer Real Estate. Realcomp II
- $212,0005 bd3 ba2.6k sqft3742 W Grand St, Detroit, MI 48238For Sale
 MLS ID #26057992, John Wallen, Michigan Dream Homes, LLC. MichRIC
- $199,9995 bd2 ba2.2k sqft4646 Pacific St, Detroit, MI 48204For SaleMLS ID #20261080598, Roberto Ortiz, Las Casas Real Estate LLC. Realcomp II
- $185,0003 bd3 ba1.5k sqft371 Piper Blvd, Detroit, MI 48215For SaleMLS ID #26022368, DeAinna Husband, Opulence Realty. MichRIC
- $150,0004 bd2 ba2.1k sqft13410 Greiner St, Detroit, MI 48205For SaleMLS ID #20261055140, Luquandra Robinson, Front Page Properties. Realcomp II
- $199,0003 bd3 ba2.4k sqft20306 Woodmont St, Harper Woods, MI 48225For SaleMLS ID #20261074342, Jennifer M Wells, Real Estate One-Northville. Realcomp II
- $189,9004 bd3 ba2.8k sqft16900 Rockdale St, Detroit, MI 48219For SaleMLS ID #20261092230, Dwala Burk, DK Caldwell Real Estate Professionals LLC. Realcomp II
- $175,0004 bd2 ba1.9k sqft5595 Oregon St, Detroit, MI 48204For Sale
 MLS ID #50221494, Nevine Rizk, Epique Inc.. MiRealSource
- $210,0003 bd2 ba1.9k sqft18717 Littlefield St, Detroit, MI 48235For SaleMLS ID #26060448, Michael Lindsay, Michael Group Realty LLC. MichRIC
- $220,0003 bd2 ba2.2k sqft16120 Forest Ave, Eastpointe, MI 48021For SaleMLS ID #50226723, Ann Peterson, Ann Peterson Realty Services. MiRealSource
- $150,0003 bd2 ba2k sqft15466 Artesian St, Detroit, MI 48223For SaleMLS ID #20261092631, Alicia D Bostick, Reach Realty Group. Realcomp II
- $150,0005 bd2 ba2.6k sqft9359 Otsego St, Detroit, MI 48204For SaleMLS ID #20261088023, Michael Gerisch, Century 21 Curran & Oberski. Realcomp II
- $199,9003 bd3 ba1.5k sqft19950 Anita St, Harper Woods, MI 48225For SaleMLS ID #26050127, Eve Boykins, Keller Williams Professionals. MichRIC
