Ideally located in South Boston’s sought-after East Side, this end-unit, single-family row house with private yard, offers approximately 1,206 square feet across three levels. Sold AS-IS and requiring a complete renovation, this property presents an exciting opportunity for developers, investors, and contractors to transform its potential.. Enjoy a prime location just one block from Carson Beach, close to Castle Island, local restaurants and shops, neighborhood parks, public transportation, and major highways.
For sale
$699,999
366 E 8th St, South Boston, MA 02127
3beds
1,206sqft
Single Family Residence
Built in 1890
1,056 Square Feet Lot
$780,200 Zestimate®
$580/sqft
$-- HOA
What's special
Private yardEnd-unit single-family row house
- 19 hours
- 385
- 12
Zillow last checked:
Listing updated:
Listed by:
Michelle McLaughlin 617-680-7686,
Maloney Properties LLC 781-943-0200
Source: MLS PIN,MLS#: 73595049
Facts & features
Interior
Bedrooms & bathrooms
- Bedrooms: 3
- Bathrooms: 2
- Full bathrooms: 1
- 1/2 bathrooms: 1
Heating
- Hot Water, Steam
Cooling
- Window Unit(s)
Features
- Has basement: No
- Number of fireplaces: 1
Interior area
- Total structure area: 1,206
- Total interior livable area: 1,206 sqft
- Finished area above ground: 1,206
Property
Lot
- Size: 1,056 Square Feet
- Features: Other
Details
- Parcel number: W:07 P:01384 S:000,1413071
- Zoning: R1
Construction
Type & style
- Home type: SingleFamily
- Architectural style: Other (See Remarks)
- Property subtype: Single Family Residence
- Attached to another structure: Yes
Materials
- Foundation: Brick/Mortar
Condition
- Year built: 1890
Utilities & green energy
- Sewer: Public Sewer
- Water: Public
Community & HOA
Community
- Features: Public Transportation, Shopping, Tennis Court(s), Walk/Jog Trails, Laundromat, Bike Path, Highway Access, House of Worship, Private School, Public School
HOA
- Has HOA: No
Location
- Region: South Boston
Financial & listing details
- Price per square foot: $580/sqft
- Tax assessed value: $728,700
- Annual tax amount: $9,036
- Date on market: 10/26/2026
Estimated market value
$780,200
$694,000 - $866,000
$5,084/mo
Price history
| Date | Event | Price |
|---|---|---|
| 10/26/2026 | Listed for sale | $699,999+723.5%$580/sqft |
Source: MLS PIN #73595049 Report a problem | ||
| 3/26/2019 | Listing removed | $3,800$3/sqft |
Source: Boston Premier Propeties Report a problem | ||
| 2/22/2019 | Listed for rent | $3,800+38.2%$3/sqft |
Source: Boston Premier Propeties Report a problem | ||
| 6/5/2017 | Listing removed | $2,750$2/sqft |
Source: Zillow Rental Manager Report a problem | ||
| 4/8/2017 | Listed for rent | $2,750$2/sqft |
Source: Zillow Rental Manager Report a problem | ||
| 5/1/1995 | Sold | $85,000$70/sqft |
Source: Public Record Report a problem | ||
Public tax history
| Year | Property taxes | Tax assessment |
|---|---|---|
| 2025 | $7,887 +6.9% | $681,100 +0.6% |
| 2024 | $7,377 +7.5% | $676,800 +6% |
| 2023 | $6,860 +7.6% | $638,700 +9% |
| 2022 | $6,374 +5% | $585,800 +3% |
| 2021 | $6,069 +3.2% | $568,800 +2.1% |
| 2020 | $5,883 +9.2% | $557,100 +9% |
| 2019 | $5,387 +5.6% | $511,100 +5% |
| 2018 | $5,103 +725.5% | $486,900 +5% |
| 2017 | $618 -86.1% | $463,500 +15% |
| 2016 | $4,434 +4.3% | $403,100 +14.8% |
| 2015 | $4,251 +13.7% | $351,000 +23.4% |
| 2013 | $3,738 +10.7% | $284,500 +9.8% |
| 2012 | $3,377 +5.4% | $259,000 +3.4% |
| 2011 | $3,203 +6.6% | $250,400 -1% |
| 2010 | $3,006 +15.6% | $253,000 +3.4% |
| 2009 | $2,600 -2.6% | $244,600 +0.5% |
| 2008 | $2,670 -2.8% | $243,400 -2.6% |
| 2007 | $2,746 | $249,900 |
Find assessor info on the county website
Monthly payment
Est. payment
Payment breakdown
Explore the cost of this home by adjusting the details. Changes won't be saved.Climate risks
Neighborhood: South Boston
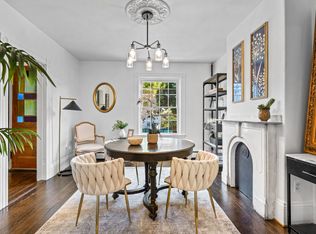


Similar homes
- $799,9003 bd1 ba1.3k sqft463 E 6th St, South Boston, MA 02127For Sale
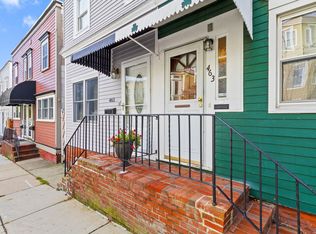 MLS ID #73590514, Tyler Smith, Real Broker MA, LLC. MLS PIN
- $699,0002 bd2 ba1.1k sqft102 Old Harbor St #A, Boston, MA 02127For Sale
 MLS ID #73576767, Jackie Rooney Team, Rooney Real Estate, LLC. MLS PIN
- $629,9993 bd1 ba941 sqft85 Baxter St #3, South Boston, MA 02127For Sale
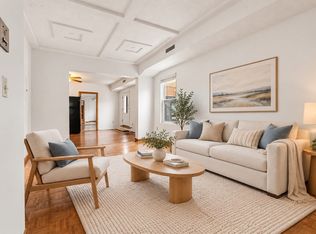 MLS ID #73591396, Anne Galvin, Coldwell Banker Realty - Dorchester. MLS PIN
- $939,0002 bd2 ba980 sqft354 Athens St, South Boston, MA 02127For Sale
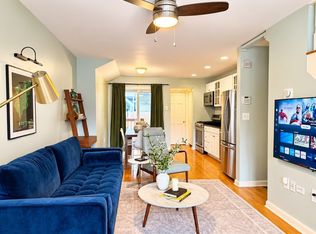 MLS ID #73593803, Melisa Sherifi Ymeri, Cameron Real Estate Group. MLS PIN
