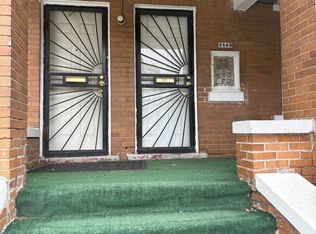
Three-unit investment opportunity featuring one 1-bedroom, one 2-bedroom, and one 3-bedroom unit, each with its own bathroom, plus a full basement. Updates completed in 2025 include a new boiler and radiators. Previously reported monthly rents of $900, $1,000, and $1,200 offer potential gross rental income of $3,100 per month when fully leased. Actual rents and future occupancy may vary. An opportunity to establish new leases as units become available.
For sale
$210,000
3803 Tyler St, Detroit, MI 48238
6beds
2,600sqft
Multi Family
Built in 1927
-- sqft lot
$-- Zestimate®
$81/sqft
$-- HOA
What's special
- 27 days
- 159
- 24
Zillow last checked:
Listing updated:
Listed by:
Jasmine Broski 734-757-5194,
JP Dwellings 734-757-5194
Source: Realcomp II,MLS#: 20261084114
Facts & features
Interior
Bedrooms & bathrooms
- Bedrooms: 6
- Bathrooms: 3
- Full bathrooms: 2
- 1/2 bathrooms: 1
Heating
- Natural Gas, Radiant
Features
- Basement: Unfinished
- Has fireplace: No
Interior area
- Total interior livable area: 2,600 sqft
- Finished area above ground: 2,600
Property
Features
- Levels: Two
- Stories: 2
- Pool features: None
Lot
- Size: 3,920 Square Feet
- Dimensions: 35 x 116
Details
- Parcel number: W14I005240S
- Zoning description: MultiFamily
- Special conditions: Short Sale No,Standard
Construction
Type & style
- Home type: MultiFamily
- Architectural style: Upper Lower Apartment
- Property subtype: Multi Family
Materials
- Brick
- Foundation: Basement, Poured
Condition
- New construction: No
- Year built: 1927
Utilities & green energy
- Sewer: Sewer At Street
- Water: Public
Community & HOA
Community
- Subdivision: SULLIVANS DEXTER BLVD 1
Location
- Region: Detroit
Financial & listing details
- Price per square foot: $81/sqft
- Tax assessed value: $61,800
- Annual tax amount: $7,533
- Date on market: 10/21/2026
- Cumulative days on market: 27 days
- Listing agreement: Exclusive Right To Sell
- Listing terms: Cash,Conventional
Estimated market value
Not available
Estimated sales range
Not available
$1,398/mo
Price history
| Date | Event | Price |
|---|---|---|
| 10/22/2026 | Listed for sale | $210,000-3.7%$81/sqft |
Source:  Realcomp II #20261084114 Report a problem | ||
| 6/9/2025 | Sold | $218,000-7.2%$84/sqft |
Source: Realcomp II #20250025465 Report a problem | ||
| 5/31/2025 | Pending sale | $234,900$90/sqft |
Source: Realcomp II #20250025465 Report a problem | ||
| 4/12/2025 | Listed for sale | $234,900+9.3%$90/sqft |
Source: Realcomp II #20250025465 Report a problem | ||
| 2/24/2025 | Listing removed | $1,100 |
Source: Zillow Rentals Report a problem | ||
| 11/15/2024 | Listed for rent | $1,100 |
Source: Zillow Rentals Report a problem | ||
| 10/21/2024 | Sold | $215,000-19%$83/sqft |
Source: Public Record Report a problem | ||
| 9/25/2024 | Pending sale | $265,555$102/sqft |
Source: Realcomp II #20240032597 Report a problem | ||
| 8/28/2024 | Price change | $265,555+13%$102/sqft |
Source: Realcomp II #20240032597 Report a problem | ||
| 8/26/2024 | Price change | $235,000-5.2%$90/sqft |
Source: Realcomp II #20240032597 Report a problem | ||
| 6/24/2024 | Price change | $247,777-6.7%$95/sqft |
Source: Realcomp II #20240032597 Report a problem | ||
| 6/17/2024 | Listed for sale | $265,555$102/sqft |
Source: Realcomp II #20240032597 Report a problem | ||
| 6/7/2024 | Pending sale | $265,555$102/sqft |
Source: Realcomp II #20240032597 Report a problem | ||
| 5/23/2024 | Price change | $265,555+0%$102/sqft |
Source: Realcomp II #20240032597 Report a problem | ||
| 5/17/2024 | Listed for sale | $265,500+86.3%$102/sqft |
Source: Realcomp II #20240032597 Report a problem | ||
| 11/28/2022 | Sold | $142,500+5.6%$55/sqft |
Source: Public Record Report a problem | ||
| 10/21/2022 | Pending sale | $135,000$52/sqft |
Source: Realcomp II #20221047940 Report a problem | ||
| 10/10/2022 | Listing removed | -- |
Source: Realcomp II #20221047940 Report a problem | ||
| 10/3/2022 | Listed for sale | $135,000+50%$52/sqft |
Source: Realcomp II #20221047940 Report a problem | ||
| 7/16/2022 | Listing removed | -- |
Source: Realcomp II #2220041588 Report a problem | ||
| 6/19/2022 | Pending sale | $90,000$35/sqft |
Source: Realcomp II #2220041588 Report a problem | ||
| 6/17/2022 | Listed for sale | $90,000$35/sqft |
Source: Realcomp II #2220041588 Report a problem | ||
| 6/15/2022 | Pending sale | $90,000$35/sqft |
Source: Realcomp II #2220041588 Report a problem | ||
| 5/30/2022 | Listed for sale | $90,000$35/sqft |
Source: Realcomp II #2220041588 Report a problem | ||
Public tax history
| Year | Property taxes | Tax assessment |
|---|---|---|
| 2026 | -- | $61,800 +3.7% |
| 2025 | -- | $59,600 +24.9% |
| 2024 | -- | $47,700 +23.9% |
| 2023 | -- | $38,500 +36% |
| 2022 | -- | $28,300 +7.6% |
| 2021 | -- | $26,300 |
| 2020 | $731 -46.8% | $26,300 +31.5% |
| 2019 | $1,373 | $20,000 -1% |
| 2018 | $1,373 | $20,200 +1.5% |
| 2017 | -- | $19,900 -50.5% |
| 2016 | $1,268 | $40,200 +229.5% |
| 2015 | $1,268 +0.9% | $12,200 -28.2% |
| 2013 | $1,257 -0.9% | $16,999 -30.2% |
| 2010 | $1,268 | $24,357 -12% |
| 2009 | -- | $27,678 -10.5% |
| 2008 | -- | $30,925 |
| 2007 | -- | $30,925 +5.5% |
| 2005 | $126 | $29,313 +3% |
| 2004 | -- | $28,459 |
Find assessor info on the county website
Monthly payment
Est. payment
Payment breakdown
Explore the cost of this home by adjusting the details. Changes won't be saved.Climate risks
Neighborhood: Russell Woods

Similar homes
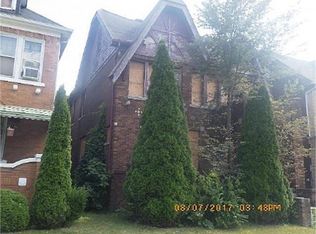
- $155,0006 bd2 ba1.9k sqft14075 Northlawn St, Detroit, MI 48238For Sale

 MLS ID #20261090079, Heather Dell, RE/MAX Leading Edge. Realcomp II
- $235,0008 bd4 ba3.4k sqft2340 W Grand St, Detroit, MI 48238For Sale
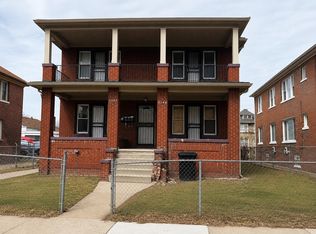
 MLS ID #50218425, Keelie Thomas, Elite Real Estate Professionals, Inc.. MiRealSource
- $235,0006 bd2 ba2.6k sqft2475 Taylor St, Detroit, MI 48206For Sale
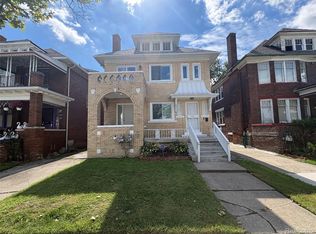 MLS ID #20261088803, Shawn R Arnaout, @properties Christie's Int'l R E Rochester. Realcomp II
- $134,9006 bd3 ba2.6k sqft3208 Pasadena St, Detroit, MI 48238For Sale
 MLS ID #20250033236, Fred Pickens, Harvest Homes Realty. Realcomp II
- $204,9004 bd2 ba2.2k sqft3840 Cortland St, Detroit, MI 48206For SaleMLS ID #20261058126, Tonia Williams, Bowers Realty & Investments, Inc. Realcomp II
- $120,0004 bd2 ba2k sqft2023 Ewald Cir, Detroit, MI 48238For SaleMLS ID #20261080756, David Rabior, Clyde Realty LLC. Realcomp II
- $153,9006 bd2 ba2.4k sqft2301 Labelle, Detroit, MI 48238For SaleMLS ID #50212860, Tamara E Leever, Keller Williams Realty Lakeside. MiRealSource
- $125,0006 bd2 ba2.3k sqft12148 Stoepel St, Detroit, MI 48204For SaleMLS ID #20261088880, Michael Gerisch, Century 21 Curran & Oberski. Realcomp II
- $209,9005 bd2 ba2k sqft50 Eason St, Highland Park, MI 48203For SaleMLS ID #20261050397, Iman Elsibai, Keller Williams Legacy. Realcomp II
- $214,9993 bd2 ba2.6k sqft18420 Santa Barbara Dr, Detroit, MI 48221For SaleMLS ID #20261066892, Deborah A Johnson, S L A Professional Realty LLC. Realcomp II
- $120,0003 bd2 ba1.6k sqft15722 Wisconsin St, Detroit, MI 48238For SaleMLS ID #20261086906, Nicholas Sehy, Keller Williams Realty-Great Lakes. Realcomp II
- $129,0003 bd2 ba1.6k sqft15873 Mendota St, Detroit, MI 48238For SaleMLS ID #20261089114, Erick Howard, Amin Realty. Realcomp II
- $217,0003 bd3 ba1.9k sqft18010 Marlowe St, Detroit, MI 48235For SaleMLS ID #20261082080, Stephanie Jackson, KW Domain. Realcomp II
- $155,0003 bd2 ba2.1k sqft18284 Hartwell St, Detroit, MI 48235For SaleMLS ID #20261091679, Tegest Walker, @properties Christie's Int'l R.E. Detroit. Realcomp II
- $185,0004 bd2 ba1.8k sqft17189 Wisconsin St, Detroit, MI 48221For SaleMLS ID #20261023834, Benjamin Ness, Clyde Realty LLC. Realcomp II
- $150,0006 bd2 ba2.8k sqft2919 Fullerton, Detroit, MI 48206For SaleMLS ID #20261088036, Michael Gerisch, Century 21 Curran & Oberski. Realcomp II
- $116,9006 bd2 ba3k sqft1732 Burlingame St, Detroit, MI 48206For SaleMLS ID #20261056050, Greg Majewski, Detroit Investment Company. Realcomp II
- $129,9006 bd2 ba1.4k sqft15349 San Juan Dr, Detroit, MI 48238For SaleMLS ID #50204629, Christopher R Gebrael, Gebrael Management. MiRealSource
- $235,0006 bd2 ba2k sqft2094 Trowbridge St, Hamtramck, MI 48212For SaleMLS ID #20261080685, Syed Yaheya, Wasim International Realty. Realcomp II
- $192,0003 bd2 ba1.5k sqft17544 Woodingham Dr, Detroit, MI 48221For SaleMLS ID #20261065981, Edgar McKinnin, Michigan Premier Realty Group LLC. Realcomp II
