Good Solid Rental Income. Motivated Seller. This property provides cashflow right now with a current tenant in place until December. A little fixup and Renovate for higher rents in the next year. $750/mo currently market rent $950. Excellent location close to I4 and Seminole Hard Rock Casino, Mid Florida Credit Union Amphitheater and more. Call today for your personal showing.
Pre-foreclosure
Est. $203,200
3809 N Garrison St, Tampa, FL 33619
2beds
600sqft
SingleFamily
Built in 1950
5,349 Square Feet Lot
$203,200 Zestimate®
$339/sqft
$-- HOA
Overview
- 68 days
- 24
- 2
Facts & features
Interior
Bedrooms & bathrooms
- Bedrooms: 2
- Bathrooms: 1
- Full bathrooms: 1
Heating
- Forced air, Electric
Cooling
- Central
Appliances
- Included: Range / Oven, Refrigerator
Features
- Other
- Flooring: Tile, Carpet
Interior area
- Structure area source: Public Records
- Total interior livable area: 600 sqft
Property
Parking
- Parking features: Off-street
Features
- Exterior features: Wood
Lot
- Size: 5,349 Square Feet
Details
- Parcel number: 1929104BY000049000160A
- Zoning: RM-16
Construction
Type & style
- Home type: SingleFamily
Materials
- masonry
- Roof: Other
Condition
- Year built: 1950
Utilities & green energy
- Sewer: Public Sewer
- Water: Public
- Utilities for property: Electricity Connected
Community & HOA
Location
- Region: Tampa
Financial & listing details
- Price per square foot: $339/sqft
- Tax assessed value: $130,736
- Annual tax amount: $1,855
Foreclosure details
Estimated market value
$203,200
$187,000 - $219,000
$1,495/mo
Price history
| Date | Event | Price |
|---|---|---|
| 5/23/2025 | Listing removed | $232,000$387/sqft |
Source:  Stellar MLS #TB8318379 Report a problem | ||
| 3/26/2025 | Price change | $232,000-4.1%$387/sqft |
Source: Stellar MLS #TB8318379 Report a problem | ||
| 11/6/2024 | Listed for sale | $242,000+46.7%$403/sqft |
Source: Stellar MLS #TB8318379 Report a problem | ||
| 7/12/2024 | Listing removed | $165,000-2.9%$275/sqft |
Source: Stellar MLS #T3300648 Report a problem | ||
| 6/28/2021 | Sold | $170,000+3%$283/sqft |
Source: Public Record Report a problem | ||
| 5/26/2021 | Pending sale | $165,000$275/sqft |
Source: Stellar MLS #T3300648 Report a problem | ||
| 5/26/2021 | Listed for sale | $165,000$275/sqft |
Source: Stellar MLS #T3300648 Report a problem | ||
| 5/2/2021 | Pending sale | $165,000+153.8%$275/sqft |
Source: Stellar MLS #T3300648 Report a problem | ||
| 11/1/2018 | Listing removed | $65,000$108/sqft |
Source: WATERFRONT REALTY TAMPABAY #U8019909 Report a problem | ||
| 10/6/2018 | Listed for sale | $65,000+30.3%$108/sqft |
Source: WATERFRONT REALTY TAMPABAY #U8019909 Report a problem | ||
| 9/8/2015 | Sold | $49,900$83/sqft |
Source: Public Record Report a problem | ||
| 5/24/2015 | Price change | $49,900-10.9%$83/sqft |
Source: CHAIS REALTY #T2733377 Report a problem | ||
| 1/8/2015 | Listed for sale | $56,000+40.4%$93/sqft |
Source: Owner Report a problem | ||
| 5/10/2014 | Listing removed | $39,900$67/sqft |
Source: chais realty #T2604765 Report a problem | ||
| 1/11/2014 | Price change | $39,900-11.1%$67/sqft |
Source: chais realty #T2604765 Report a problem | ||
| 12/10/2013 | Listed for sale | $44,900-25.2%$75/sqft |
Source: chais realty #T2604765 Report a problem | ||
| 6/9/2006 | Sold | $60,000+81.8%$100/sqft |
Source: Public Record Report a problem | ||
| 3/29/2002 | Sold | $33,000$55/sqft |
Source: Public Record Report a problem | ||
Public tax history
| Year | Property taxes | Tax assessment |
|---|---|---|
| 2025 | $1,855 +7.1% | $130,736 +1.8% |
| 2024 | $1,732 +3.6% | $128,382 +3% |
| 2023 | $1,673 -9.5% | $124,643 -6.4% |
| 2022 | $1,848 +35.9% | $133,172 +114.4% |
| 2021 | $1,360 +11.3% | $62,102 +10% |
| 2020 | $1,221 +35.4% | $56,456 +56.2% |
| 2019 | $902 | $36,154 -11% |
| 2018 | $902 +11.9% | $40,625 +36% |
| 2017 | $806 +15.7% | $29,879 +3.3% |
| 2016 | $696 +4.1% | $28,932 +20% |
| 2015 | $668 +56.3% | $24,108 +28.3% |
| 2014 | $428 | $18,797 +10% |
| 2013 | $428 +16.4% | $17,088 +6.6% |
| 2012 | $367 -25.9% | $16,031 -27% |
| 2011 | $496 -18.5% | $21,962 -19.7% |
| 2010 | $609 -41% | $27,366 -41.6% |
| 2009 | $1,033 -17.9% | $46,859 -17.9% |
| 2008 | $1,259 -6.1% | $57,045 -7.3% |
| 2007 | $1,340 +12.9% | $61,525 +23.8% |
| 2006 | $1,187 +11% | $49,708 +14.6% |
| 2005 | $1,069 | $43,373 +23.7% |
| 2004 | -- | $35,054 +28.3% |
| 2003 | -- | $27,332 -2.4% |
| 2002 | -- | $28,007 +43.2% |
| 2001 | -- | $19,552 -13.1% |
| 2000 | -- | $22,508 |
Find assessor info on the county website
Monthly payment
Climate risks
Neighborhood: Grant Park
Nearby schools
Schools provided by the listing agent
- Elementary: Oak Park-HB
- Middle: Burnett-HB
- High: Blake-HB
Source: The MLS. This data may not be complete. We recommend contacting the local school district to confirm school assignments for this home.


Similar homes
- $199,9003 bd1 ba735 sqft3916 E GENESEE STREET, TAMPA, FL 33610For Sale

 MLS ID #TB8505801, Lynne Powers, POWERS REAL ESTATE SOLUTIONS LLC. Stellar MLS
- $210,0002 bd1 ba744 sqft4509 N 29TH STREET, TAMPA, FL 33610For Sale
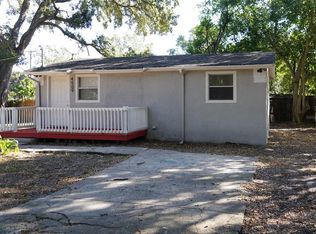 MLS ID #TB8494603, Tracy Holmes, INVESTCOR REALTY LLC. Stellar MLS
- $239,9993 bd1 ba850 sqft4615 N 38TH STREET, TAMPA, FL 33610For Sale
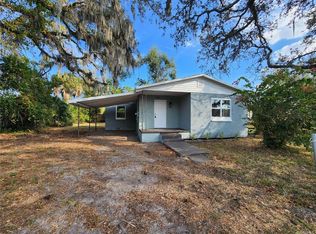 MLS ID #TB8558042, Donna Parrish, CHARLES RUTENBERG REALTY INC. Stellar MLS
- $245,0003 bd1 ba888 sqft7615 LAVENDER LANE, TAMPA, FL 33619For Sale
 MLS ID #TB8545933, Luis Cortes, HOME PRIME REALTY LLC. Stellar MLS
- $215,0002 bd1 ba732 sqft2410 E COLUMBUS DRIVE, TAMPA, FL 33605For SaleMLS ID #TB8543849, Destiny Rodriguez, KELLER WILLIAMS ST PETE REALTY. Stellar MLS
- $229,9992 bd1 ba616 sqft1804 E PALIFOX STREET, TAMPA, FL 33610For SaleMLS ID #TB8474786, Christy Morgan, RE/MAX COLLECTIVE. Stellar MLS
- $199,9002 bd1 ba720 sqft8113 N SEMMES STREET, TAMPA, FL 33604For SaleMLS ID #TB8550866, Lynne Powers, POWERS REAL ESTATE SOLUTIONS LLC. Stellar MLS
- $189,0003 bd1 ba824 sqft3404 E 33RD AVENUE, TAMPA, FL 33610For SaleMLS ID #L4958834, Kristin Kellin, KELLER WILLIAMS REALTY. Stellar MLS
- $225,0003 bd1 ba888 sqft5020 S 86TH STREET, TAMPA, FL 33619For SaleMLS ID #TB8534347, Helene Raich, GOOD 2 GO PROPERTY, LLC. Stellar MLS
- $269,0003 bd2 ba851 sqft1202 E OSBORNE AVENUE, TAMPA, FL 33603For SaleMLS ID #TB8566758, Jatnna Jimenez, LPT REALTY, LLC. Stellar MLS
- $214,9002 bd2 ba760 sqft8316 N KLONDYKE STREET, TAMPA, FL 33604For SaleMLS ID #TB8550862, Lynne Powers, POWERS REAL ESTATE SOLUTIONS LLC. Stellar MLS
- $249,8973 bd1 ba724 sqft2110 E ELLICOTT STREET, TAMPA, FL 33610For SaleMLS ID #TB8561921, Bertram Nkya, A BETTER LIFE REALTY. Stellar MLS
- $255,0003 bd1 ba812 sqft4214 E PALIFOX STREET, TAMPA, FL 33610For SaleMLS ID #TB8543350, Kristen Chester, DALTON WADE INC. Stellar MLS
- $214,9002 bd1 ba852 sqft910 E ESKIMO AVENUE, TAMPA, FL 33604For SaleMLS ID #TB8554667, Aprilyn Cloyd, REALTY ONE GROUP INNOVATION. Stellar MLS
- $219,9002 bd1 ba656 sqft1812 E OKALOOSA AVENUE, TAMPA, FL 33604For SaleMLS ID #TB8526411, Ana Acosta, NEW BEGINNING REALTY LLC. Stellar MLS
- $269,9002 bd1 ba733 sqft2020 E POWHATAN AVENUE, TAMPA, FL 33610For SaleMLS ID #TB8563377, David O'Brien, STAR BAY REALTY CORP.. Stellar MLS
- $234,0003 bd1 ba818 sqft8103 N 18TH STREET, TAMPA, FL 33604For SaleMLS ID #O6436636, Karen Albright, OPENDOOR BROKERAGE LLC. Stellar MLS
- $275,0003 bd1 ba884 sqft3417 DANNY BRYAN BOULEVARD, TAMPA, FL 33619For SaleMLS ID #TB8536924, Andrew Duncan, LPT REALTY LLC. Stellar MLS
- $300,0003 bd2 ba832 sqft6511 24TH AVENUE S, TAMPA, FL 33619For SaleMLS ID #TB8445487, Yida Urtiaga Alvarez, HOME PRIME REALTY LLC. Stellar MLS
- $234,0003 bd1 ba864 sqft2116 E ELLICOTT STREET, TAMPA, FL 33610For SaleMLS ID #TB8519448, Tina Danielson, REALTY ONE GROUP ADVANTAGE. Stellar MLS
