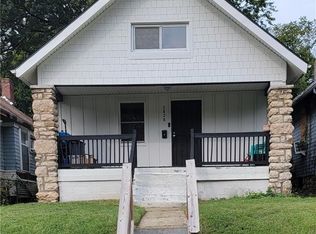
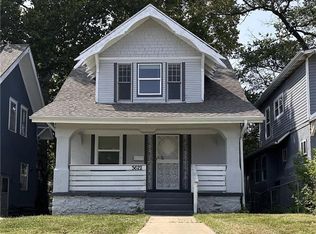
$79,900
3 bd1 ba1.1k sqft
3816 Indiana Ave, Kansas City, MO 64128
Off Market
Likely to sell faster than
Zillow last checked:
Listing updated:
Emanuel Blando 816-745-8906,
KW KANSAS CITY METRO

Not available
Estimated sales range
Not available
Not available
| Date | Event | Price |
|---|---|---|
| 11/13/2026 | Listed for sale | $114,500+4.1%$94/sqft |
Source:  Heartland MLS as distributed by MLS GRID #2651655 Report a problem | ||
| 5/22/2026 | Listing removed | $1,145$1/sqft |
Source: Zillow Rentals Report a problem | ||
| 4/22/2026 | Price change | $1,145-4.6%$1/sqft |
Source: Zillow Rentals Report a problem | ||
| 2/23/2026 | Price change | $1,200-5.9%$1/sqft |
Source: Zillow Rentals Report a problem | ||
| 2/6/2026 | Listed for rent | $1,275+27.5%$1/sqft |
Source: Zillow Rentals Report a problem | ||
| 1/30/2026 | Listing removed | $110,000$90/sqft |
Source: Heartland MLS as distributed by MLS GRID #2579853 Report a problem | ||
| 1/25/2026 | Price change | $110,000-4.3%$90/sqft |
Source: Heartland MLS as distributed by MLS GRID #2579853 Report a problem | ||
| 1/2/2026 | Price change | $115,000-8%$94/sqft |
Source: Heartland MLS as distributed by MLS GRID #2579853 Report a problem | ||
| 11/6/2025 | Price change | $125,000-3.8%$102/sqft |
Source: Heartland MLS as distributed by MLS GRID #2579853 Report a problem | ||
| 10/10/2025 | Listed for sale | $130,000$106/sqft |
Source: Heartland MLS as distributed by MLS GRID #2579853 Report a problem | ||
| 9/23/2025 | Listing removed | $1,000$1/sqft |
Source: Zillow Rentals Report a problem | ||
| 9/18/2025 | Price change | $1,000-2.4%$1/sqft |
Source: Zillow Rentals Report a problem | ||
| 8/8/2025 | Price change | $1,025-1.9%$1/sqft |
Source: Zillow Rentals Report a problem | ||
| 6/26/2025 | Price change | $1,045-5%$1/sqft |
Source: Zillow Rentals Report a problem | ||
| 6/13/2025 | Price change | $1,100-3.9%$1/sqft |
Source: Zillow Rentals Report a problem | ||
| 5/29/2025 | Price change | $1,145-4.2%$1/sqft |
Source: Zillow Rentals Report a problem | ||
| 5/15/2025 | Price change | $1,195-4.4%$1/sqft |
Source: Zillow Rentals Report a problem | ||
| 4/11/2025 | Listed for rent | $1,250-28.6%$1/sqft |
Source: Zillow Rentals Report a problem | ||
| 6/18/2024 | Listing removed | -- |
Source: Zillow Rentals Report a problem | ||
| 6/11/2024 | Listed for rent | $1,750$1/sqft |
Source: Zillow Rentals Report a problem | ||
| Year | Property taxes | Tax assessment |
|---|---|---|
| 2025 | $506 -35% | $6,031 -38.9% |
| 2024 | $778 +1% | $9,863 |
| 2023 | $771 +105.6% | $9,863 +116.2% |
| 2022 | $375 +0.3% | $4,561 |
| 2021 | $374 +5.4% | $4,561 +6.7% |
| 2020 | $355 +2.1% | $4,275 |
| 2019 | $347 | $4,275 -15.5% |
| 2018 | $347 -17.2% | $5,058 |
| 2017 | $420 +6.5% | $5,058 +2.6% |
| 2016 | $394 -0.6% | $4,931 |
| 2014 | $396 -0.5% | $4,931 |
| 2013 | $398 +0.5% | $4,931 |
| 2012 | $397 +0.1% | $4,931 |
| 2011 | $396 +0.9% | $4,931 |
| 2010 | $393 -25.6% | $4,931 |
| 2009 | $528 +0.5% | $4,931 -26% |
| 2008 | $526 +14% | $6,665 |
| 2007 | $461 +0% | $6,665 +15% |
| 2006 | $461 +13.9% | $5,795 |
| 2005 | $405 +0.1% | $5,795 +12.5% |
| 2004 | $404 +14.3% | $5,153 |
| 2003 | $354 +0.3% | $5,153 +15% |
| 2002 | $353 +11.4% | $4,481 |
| 2001 | $317 | $4,481 |


A local agent can set up tours, give advice and negotiate with sellers.