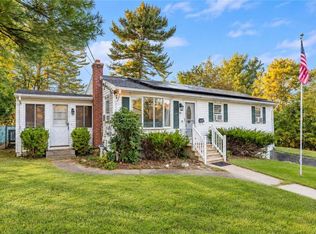
This classic 3 bedroom Raised ranch is set in the highly desirable Highwood Estates! The property is on an acre of land which is one of the biggest lots in the neighborhood. This home is a fixer upper with strong equity potential!
Active
$399,900
39 Highwood Dr, Coventry, RI 02816
3beds
1,714sqft
Single Family Residence
Built in 1981
0.92 Acres Lot
$-- Zestimate®
$233/sqft
$-- HOA
What's special
- 16 days
- 2,242
- 227
Likely to sell faster than
Zillow last checked:
Listing updated:
Listed by:
Julie Pettigrew 401-487-3551,
RI Real Estate Services
Source: StateWide MLS RI,MLS#: 1427420
Facts & features
Interior
Bedrooms & bathrooms
- Bedrooms: 3
- Bathrooms: 1
- Full bathrooms: 1
Bathroom
- Features: Bath w Tub & Shower
Heating
- Natural Gas, Forced Air
Cooling
- Central Air
Features
- Plumbing (Mixed), Insulation (Unknown), Ceiling Fan(s)
- Flooring: Ceramic Tile, Laminate, Carpet
- Windows: Insulated Windows
- Basement: Full,Walk-Out Access,Partially Finished,Family Room,Laundry,Office
- Has fireplace: No
- Fireplace features: None
Interior area
- Total structure area: 994
- Total interior livable area: 1,714 sqft
- Finished area above ground: 994
- Finished area below ground: 720
Video & virtual tour
Property
Parking
- Total spaces: 6
- Parking features: No Garage, Driveway
- Has uncovered spaces: Yes
Lot
- Size: 0.92 Acres
Details
- Parcel number: COVEM69L15
Construction
Type & style
- Home type: SingleFamily
- Architectural style: Raised Ranch
- Property subtype: Single Family Residence
Materials
- Shingles, Vinyl Siding
- Foundation: Concrete Perimeter
Condition
- New construction: No
- Year built: 1981
Utilities & green energy
- Electric: Circuit Breakers
- Sewer: Septic Tank
- Utilities for property: Water Connected
Community & HOA
Community
- Subdivision: Highwood Estates
HOA
- Has HOA: No
Location
- Region: Coventry
Financial & listing details
- Price per square foot: $233/sqft
- Tax assessed value: $325,500
- Annual tax amount: $5,166
- Date on market: 10/30/2026
Estimated market value
Not available
Estimated sales range
Not available
Not available
Price history
| Date | Event | Price |
|---|---|---|
| 11/7/2026 | Listed for sale | $399,900+217.4%$233/sqft |
Source:  StateWide MLS RI #1427420 Report a problem | ||
| 5/28/1999 | Sold | $126,000+5%$74/sqft |
Source: Public Record Report a problem | ||
| 9/1/1998 | Sold | $120,000$70/sqft |
Source: Public Record Report a problem | ||
Public tax history
| Year | Property taxes | Tax assessment |
|---|---|---|
| 2025 | $5,156 | $325,500 |
| 2024 | $5,156 +3.3% | $325,500 |
| 2023 | $4,990 -4.2% | $325,500 +22.3% |
| 2022 | $5,210 +0.9% | $266,200 |
| 2021 | $5,164 -12.8% | $266,200 |
| 2020 | $5,920 +13.6% | $266,200 +13.7% |
| 2019 | $5,209 +2.9% | $234,200 |
| 2018 | $5,061 +3% | $234,200 |
| 2017 | $4,914 +6.1% | $234,200 +8.2% |
| 2016 | $4,633 +2.8% | $216,400 |
| 2015 | $4,508 +2.1% | $216,400 |
| 2014 | $4,413 +3.8% | $216,400 -5% |
| 2013 | $4,253 +1.4% | $227,900 -1.9% |
| 2012 | $4,194 -4.6% | $232,200 -18.4% |
| 2010 | $4,398 | $284,500 |
| 2009 | $4,398 | $284,500 |
| 2008 | $4,398 +7.9% | $284,500 +9.5% |
| 2007 | $4,076 +5% | $259,760 |
| 2006 | $3,881 +6% | $259,760 +81.8% |
| 2003 | $3,663 | $142,920 |
Find assessor info on the county website
Monthly payment
Est. payment
Payment breakdown
Explore the cost of this home by adjusting the details. Changes won't be saved.Climate risks
Neighborhood: 02816

Similar homes
- $425,0003 bd1 ba1.2k sqft6 Centre St, Coventry, RI 02816For Sale

 MLS ID #1426843, Rhonda Schneider, RE/MAX ADVANTAGE GROUP. StateWide MLS RI
- $410,0003 bd1 ba1.8k sqft28 Rosemary St, Coventry, RI 02816For Sale
 MLS ID #1426372, Ryan Lineham, Homistic Real Estate, Inc.. StateWide MLS RI
- $475,0003 bd2 ba1.8k sqft986 Knotty Oak Rd, Coventry, RI 02816For Sale
 MLS ID #1422830, Sharon Ruhle, BHHS Pinnacle Realty. StateWide MLS RI
- $374,9003 bd2 ba1.1k sqft11 Sunset Ave, Coventry, RI 02816For Sale
 MLS ID #1418988, Derek Greene, The Greene Realty Group. StateWide MLS RI
- $549,0003 bd2 ba1.6k sqft1141 Fish Hill Rd, Coventry, RI 02816For SaleMLS ID #1427223, Twin Tides Team, SERHANT.. StateWide MLS RI
- $500,0003 bd2 ba1.7k sqft9 Eastgate Dr, Coventry, RI 02816For SaleMLS ID #1422883, Brian Greene, Keller Williams Leading Edge. StateWide MLS RI
- $299,9992 bd1 ba1.7k sqft30 Ames St, Coventry, RI 02816For SaleMLS ID #1426527, The Renee Moussally Team, Coldwell Banker Realty. StateWide MLS RI
- $414,7023 bd1 ba1k sqft37 Ridge Rd, East Greenwich, RI 02818For SaleMLS ID #1428483, Lauren Grilli, RI Real Estate Services. StateWide MLS RI
- $399,9993 bd2 ba2.2k sqft10 Park Blvd, West Warwick, RI 02893For SaleMLS ID #1427476, Christine Meschino, Start Realty. StateWide MLS RI
- $399,9003 bd2 ba1.4k sqft60 Old Danielson Pike, Foster, RI 02825For SaleMLS ID #1428159, Greg Coupe, Long Realty, Inc.. StateWide MLS RI
- $550,0003 bd1 ba1.7k sqft1720 Harkney Hill Rd, Coventry, RI 02816For SaleMLS ID #1425709, Aaron Coutu, Keller Williams Leading Edge. StateWide MLS RI
- $429,9993 bd2 ba1.8k sqft686 Squaw Rock Road, Plainfield, CT 06354For Sale
 MLS ID #24221091, Ashley Walker, Kazantzis Real Estate, LLC. Smart MLS
- $548,0004 bd2 ba1.9k sqft569 Hill Farm Rd, Coventry, RI 02816For SaleMLS ID #1426559, Team KEY, KEY Real Estate Services. StateWide MLS RI
- $375,0003 bd2 ba2.1k sqft26 Fornelli St, West Warwick, RI 02893For SaleMLS ID #1424669, Jesiane Fernandes, Real Broker, LLC. StateWide MLS RI
- $584,9003 bd3 ba2.4k sqft21 Casey Ln, Coventry, RI 02816For SaleMLS ID #1422469, The Rachel Jones Team, SKD Real Estate. StateWide MLS RI
- $499,9003 bd1 ba1.5k sqft425 Hope Rd, Cranston, RI 02921For SaleMLS ID #1427922, Jason Ferri, RE/MAX Professionals. StateWide MLS RI
- $399,9003 bd1 ba1.2k sqft22 Cooke Pl, Warwick, RI 02888For SaleMLS ID #1427875, Angelo Greco, Greco Real Estate. StateWide MLS RI
- $399,9003 bd2 ba1.3k sqft67 Mountaindale Rd, Smithfield, RI 02917For SaleMLS ID #1421781, Frank Sullivan, CALDWELL REALTY LLC. StateWide MLS RI
- $385,0003 bd1 ba1k sqft97 Keeley Ave, Warwick, RI 02886For SaleMLS ID #1426641, Jennifer Eaton, Ocean Roads Realty LLC. StateWide MLS RI
- $399,9903 bd2 ba1.1k sqft1356 S Broadway, East Providence, RI 02914For SaleMLS ID #1427699, Kassi Mazzucco, Compass. StateWide MLS RI
