This 1146 square foot single family home has 2 bedrooms and 1.0 bathrooms. This home is located at 4073 Ruby St, Sanford, FL 32771.
Pre-foreclosure
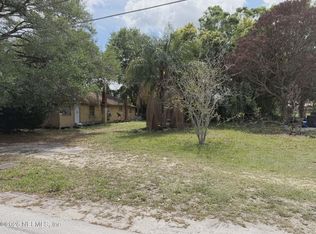
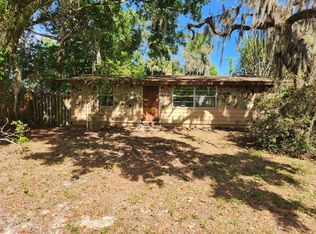
Street View
Est. $123,100
4073 Ruby St, Sanford, FL 32771
2beds
1baths
1,146sqft
SingleFamily
Built in 1920
5,880 Square Feet Lot
$123,100 Zestimate®
$107/sqft
$-- HOA
Overview
- 152 days |
- 21 |
- 0 |
Facts & features
Interior
Bedrooms & bathrooms
- Bedrooms: 2
- Bathrooms: 1
Heating
- Other
Features
- Flooring: Other, Hardwood
- Basement: Partially finished
Interior area
- Total interior livable area: 1,146 sqft
Property
Parking
- Parking features: Carport
Features
- Exterior features: Other
Lot
- Size: 5,880 Square Feet
Details
- Parcel number: 2819305060000020I
Construction
Type & style
- Home type: SingleFamily
Materials
- wood frame
- Foundation: Piers
- Roof: Composition
Condition
- Year built: 1920
Community & HOA
Location
- Region: Sanford
Financial & listing details
- Price per square foot: $107/sqft
- Tax assessed value: $58,105
- Annual tax amount: $1,044
Visit our professional directory to find a foreclosure specialist in your area that can help with your home search.
Find a foreclosure agentForeclosure details
Estimated market value
$123,100
$95,000 - $160,000
$1,682/mo
Price history
| Date | Event | Price |
|---|---|---|
| 10/13/2000 | Sold | $10,000$9/sqft |
Source: Public Record Report a problem | ||
Public tax history
| Year | Property taxes | Tax assessment |
|---|---|---|
| 2025 | $1,044 +10.4% | $57,405 +10% |
| 2024 | $946 +40.7% | $52,186 +10% |
| 2023 | $672 +8.1% | $47,442 +10% |
| 2022 | $622 -19.1% | $43,129 +10% |
| 2021 | $769 +1.2% | $39,208 +1.6% |
| 2020 | $760 +156.1% | $38,572 +17% |
| 2019 | $297 | $32,956 +1.9% |
| 2018 | $297 +3.2% | $32,342 +2.1% |
| 2017 | $287 +3.4% | $31,677 +1.4% |
| 2016 | $278 +6.5% | $31,242 +1.4% |
| 2015 | $261 | $30,809 +0.4% |
| 2014 | $261 +348.2% | $30,685 +1.5% |
| 2013 | $58 +5.7% | $30,232 -0.1% |
| 2012 | $55 -23.2% | $30,250 -4.7% |
| 2011 | $72 -25.5% | $31,730 -6.4% |
| 2010 | $96 +12.2% | $33,895 +2.7% |
| 2009 | $86 +2.1% | $33,004 +0.1% |
| 2008 | $84 +15.2% | $32,971 +3% |
| 2007 | $73 +5.4% | $32,011 +2.5% |
| 2006 | $69 +14.3% | $31,230 +3% |
| 2005 | $61 +14.7% | $30,320 +3% |
| 2004 | $53 +11.8% | $29,437 +1.9% |
| 2003 | $47 +18.3% | $28,888 +2.4% |
| 2002 | $40 +15.3% | $28,211 +4.6% |
| 2000 | $35 | $26,958 |
Find assessor info on the county website
Monthly payment
Estimated monthly payment$1,822
All calculations are estimates and provided by Zillow, Inc. for informational purposes only. Actual amounts may vary.
HOA fees may include property taxes on listings classified as Co-Ops. Contact the listing agent and/or owner for fee details.
Mortgage interest rates are dependent on a number of factors, including credit score, down payment, and repayment length. Interest rate data provided by Zillow Group Marketplace, Inc. as of 1/1/1970 from various mortgage lenders with which we have lead or other similar arrangements; the Estimated Payment is an average of those rates.
See how much you could borrow to make a competitive offer.
Climate risks
Neighborhood: 32771
Nearby schools
GreatSchools rating
- 8/10Bentley Elementary SchoolGrades: PK-5Distance: 1.1 mi
- 6/10Markham Woods Middle SchoolGrades: 6-8Distance: 4.1 mi
- 5/10Seminole High SchoolGrades: 9-12Distance: 3 mi


- Florida
- Seminole County
- Sanford
- 32771
- 4073 Ruby St
Nearby cities
Nearby zip codes
Other Sanford Topics
