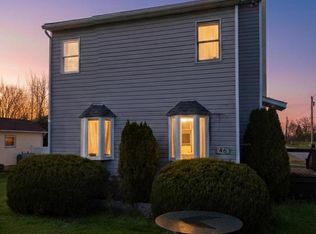
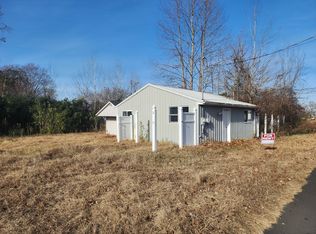
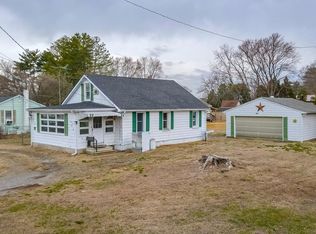
This 1152 square foot single family home has 3 bedrooms and 1.0 bathrooms. This home is located at 44 Tilbury Rd, Salem, NJ 08079.
Foreclosed
Street View
Est. $221,100
44 Tilbury Rd, Salem, NJ 08079
3beds
1,152sqft
SingleFamily
Built in 1950
7,048 Square Feet Lot
$221,100 Zestimate®
$192/sqft
$-- HOA
Overview
- 69 days |
- 70 |
- 3 |
Facts & features
Interior
Bedrooms & bathrooms
- Bedrooms: 3
- Bathrooms: 1
- Full bathrooms: 1
Heating
- Forced air, Electric, Oil
Cooling
- Refrigerator, Central
Appliances
- Included: Dryer, Microwave, Range / Oven, Refrigerator, Washer
Features
- Flooring: Tile, Carpet, Hardwood, Linoleum / Vinyl
- Basement: None
Interior area
- Total interior livable area: 1,152 sqft
- Finished area below ground: 0
Property
Parking
- Total spaces: 3
- Parking features: Off-street
Features
- Exterior features: Stone, Vinyl
Lot
- Size: 7,048 Square Feet
Details
- Parcel number: 040000600000002001
- Special conditions: Standard
Construction
Type & style
- Home type: SingleFamily
- Architectural style: Ranch/Rambler
Materials
- Roof: Asphalt
Condition
- Year built: 1950
Community & HOA
Location
- Region: Salem
- Municipality: ELSINBORO TWP
Financial & listing details
- Price per square foot: $192/sqft
- Tax assessed value: $121,800
- Annual tax amount: $3,800
Visit our professional directory to find a foreclosure specialist in your area that can help with your home search.
Find a foreclosure agentForeclosure details
Estimated market value
$221,100
$206,000 - $234,000
$1,988/mo
Price history
| Date | Event | Price |
|---|---|---|
| 5/28/2025 | Listing removed | $199,900$174/sqft |
Source: | ||
| 3/3/2025 | Price change | $199,900-9.1%$174/sqft |
Source: | ||
| 12/27/2024 | Listed for sale | $219,900+33.3%$191/sqft |
Source: | ||
| 9/13/2022 | Sold | $165,000+266.7%$143/sqft |
Source: Public Record Report a problem | ||
| 12/4/2020 | Sold | $45,000$39/sqft |
Source: Public Record Report a problem | ||
| 9/29/2020 | Pending sale | $45,000$39/sqft |
Source: American Dream Realty of South Jersey #NJSA137332 Report a problem | ||
| 9/3/2020 | Price change | $45,000-30.8%$39/sqft |
Source: American Dream Realty of South Jersey #NJSA137332 Report a problem | ||
| 6/26/2020 | Pending sale | $65,000$56/sqft |
Source: American Dream Realty of South Jersey #NJSA137332 Report a problem | ||
| 5/21/2020 | Price change | $65,000-7.1%$56/sqft |
Source: American Dream Realty of South Jersey #NJSA137332 Report a problem | ||
| 2/24/2020 | Listed for sale | $70,000-34%$61/sqft |
Source: American Dream Realty of South #NJSA137332 Report a problem | ||
| 1/16/2020 | Listing removed | $106,000$92/sqft |
Source: BHHS Fox & Roach Mullica Hill #NJSA135558 Report a problem | ||
| 9/10/2019 | Listed for sale | $106,000-14.9%$92/sqft |
Source: BHHS Fox & Roach-Mullica Hill South #NJSA135558 Report a problem | ||
| 6/1/2010 | Sold | $124,500-3.5%$108/sqft |
Source: Public Record Report a problem | ||
| 4/5/2010 | Listed for sale | $129,000$112/sqft |
Source: CENTURY 21 Town & Country Realty #5666363 Report a problem | ||
Public tax history
| Year | Property taxes | Tax assessment |
|---|---|---|
| 2025 | $3,800 | $121,800 |
| 2024 | $3,800 +5.5% | $121,800 |
| 2023 | $3,602 +3.5% | $121,800 |
| 2022 | $3,479 +1.2% | $121,800 |
| 2021 | $3,437 +1.4% | $121,800 |
| 2020 | $3,388 +2.4% | $121,800 |
| 2019 | $3,309 +2.1% | $121,800 |
| 2018 | $3,242 +3.8% | $121,800 |
| 2017 | $3,124 +5.9% | $121,800 |
| 2016 | $2,950 +3.4% | $121,800 |
| 2015 | $2,854 -0.7% | $121,800 |
| 2014 | $2,874 +3.6% | $121,800 |
| 2013 | $2,773 +5.7% | $121,800 |
| 2012 | $2,625 +2.9% | $121,800 |
| 2011 | $2,552 +3.1% | $121,800 |
| 2009 | $2,475 | $121,800 |
| 2008 | -- | $121,800 +93.6% |
| 2007 | -- | $62,900 |
| 2006 | -- | $62,900 |
| 2005 | -- | $62,900 |
| 2004 | -- | $62,900 |
| 2003 | -- | $62,900 |
| 2002 | -- | $62,900 |
| 2001 | -- | $62,900 |
Find assessor info on the county website
Monthly payment
Estimated monthly payment$1,822
All calculations are estimates and provided by Zillow, Inc. for informational purposes only. Actual amounts may vary.
HOA fees may include property taxes on listings classified as Co-Ops. Contact the listing agent and/or owner for fee details.
Mortgage interest rates are dependent on a number of factors, including credit score, down payment, and repayment length. Interest rate data provided by Zillow Group Marketplace, Inc. as of 1/1/1970 from various mortgage lenders with which we have lead or other similar arrangements; the Estimated Payment is an average of those rates.
See how much you could borrow to make a competitive offer.
Climate risks
Neighborhood: 08079
Nearby schools
GreatSchools rating
- 5/10Elsinboro Township SchoolGrades: PK-8Distance: 2.1 mi
Schools provided by the listing agent
- Elementary: ELSINBORO E.S.
- Middle: ELSINBORO TOWNSHIP SCHOOL
- High: SALEM H.S.
- District: ELSINBORO TOWNSHIP PUBLIC SCHOOLS
Source: The MLS. This data may not be complete. We recommend contacting the local school district to confirm school assignments for this home.


- New Jersey
- Salem County
- Salem
- 08079
- 44 Tilbury Rd
Nearby cities
Nearby zip codes
Other Salem Topics
