excellent single story 4 Bed. 2 bath house,
in a nice area of Lancaster, designed for a large family, nice curb appeal
For sale
$449,900
44033 Glenraven Rd, Lancaster, CA 93535
4beds
1,887sqft
Single Family Residence
Built in 1980
8,276 Square Feet Lot
$449,800 Zestimate®
$238/sqft
$-- HOA
What's special
- 7 days
- 127
- 4
Likely to sell faster than
Zillow last checked:
Listing updated:
Listed by:
Salomon Maldonado DRE #01094739 818-830-6640,
S & R Properties
Source: GAVAR,MLS#: 26008464
Facts & features
Interior
Bedrooms & bathrooms
- Bedrooms: 4
- Bathrooms: 2
- Full bathrooms: 2
Heating
- Has Heating (Unspecified Type)
Cooling
- Has cooling: Yes
Appliances
- Included: None
Features
- Flooring: Carpet
- Has fireplace: No
- Fireplace features: None
Interior area
- Total structure area: 1,887
- Total interior livable area: 1,887 sqft
Property
Parking
- Total spaces: 2
- Parking features: Garage - Attached
- Attached garage spaces: 2
Features
- Stories: 1
- Pool features: None
- Fencing: Block,Wood
Lot
- Size: 8,276 Square Feet
- Features: Unknown
Details
- Parcel number: 3141020024
- Zoning: R 1
Construction
Type & style
- Home type: SingleFamily
- Architectural style: Traditional
- Property subtype: Single Family Residence
Materials
- Frame, Stucco
- Foundation: Slab
- Roof: Shingle
Condition
- Year built: 1980
Utilities & green energy
- Water: Public
- Utilities for property: Sewer Connected
Community & HOA
Location
- Region: Lancaster
Financial & listing details
- Price per square foot: $238/sqft
- Tax assessed value: $164,642
- Date on market: 11/9/2026
- Listing agreement: Exclusive Right To Sell
- Listing terms: Conventional,FHA
- Road surface type: Paved
Estimated market value
$449,800
$427,000 - $472,000
$2,777/mo
Price history
| Date | Event | Price |
|---|---|---|
| 10/31/2026 | Listed for sale | $449,900+257.1%$238/sqft |
Source:  CRMLS #SR26234728 Report a problem | ||
| 12/30/2010 | Sold | $126,000+22.6%$67/sqft |
Source: Public Record Report a problem | ||
| 6/22/2010 | Sold | $102,775-66.3%$54/sqft |
Source: Public Record Report a problem | ||
| 7/28/2005 | Sold | $305,000+134.6%$162/sqft |
Source: Public Record Report a problem | ||
| 3/1/2002 | Sold | $130,000+50.3%$69/sqft |
Source: Public Record Report a problem | ||
| 7/30/1996 | Sold | $86,500+8.1%$46/sqft |
Source: Public Record Report a problem | ||
| 4/1/1996 | Sold | $80,000$42/sqft |
Source: Public Record Report a problem | ||
Public tax history
| Year | Property taxes | Tax assessment |
|---|---|---|
| 2026 | -- | $164,642 +2% |
| 2025 | $3,436 +6.3% | $161,415 +2% |
| 2024 | $3,232 +2.1% | $158,251 +2% |
| 2023 | $3,166 +6.3% | $155,149 +2% |
| 2022 | $2,977 +15% | $152,108 +2% |
| 2021 | $2,589 +1.1% | $149,126 +1% |
| 2020 | $2,561 | $147,598 +2% |
| 2019 | $2,561 +3.5% | $144,705 +2% |
| 2018 | $2,474 | $141,869 +2% |
| 2017 | $2,474 +1.1% | $139,088 +2% |
| 2016 | $2,447 +4.5% | $136,362 +1.5% |
| 2015 | $2,341 +1.4% | $134,315 +2% |
| 2014 | $2,308 | $131,685 +2.5% |
| 2012 | -- | $128,520 +2% |
| 2011 | -- | $126,000 +21% |
| 2010 | -- | $104,100 -22.3% |
| 2009 | -- | $134,000 -56.4% |
| 2008 | -- | $307,500 -1.2% |
| 2007 | -- | $311,100 +2% |
| 2006 | -- | $305,000 +117% |
| 2005 | -- | $140,531 +4% |
| 2004 | -- | $135,075 +1.9% |
| 2003 | -- | $132,600 +39.1% |
| 2002 | -- | $95,359 +4% |
| 2000 | -- | $91,659 |
Find assessor info on the county website
Monthly payment
Est. payment
Payment breakdown
Explore the cost of this home by adjusting the details. Changes won't be saved.Climate risks
Neighborhood: Joshua


Similar homes
- $439,9004 bd4 ba1.8k sqft43956 Gillan Ave, Lancaster, CA 93535For Sale
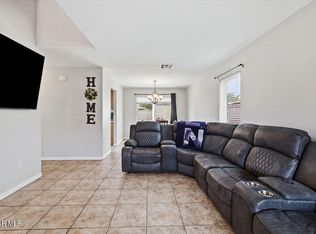 MLS ID #26008581, Nancy Cueva. GAVAR
- $449,0004 bd2 ba1.2k sqft45517 Sancroft Ave, Lancaster, CA 93535For Sale
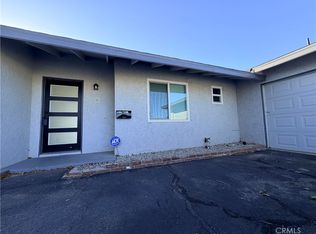 MLS ID #DW26226750, Ronald Morales, Century 21 Allstars. CRMLS
- $429,9004 bd3 ba1.7k sqft663 E Kettering St, Lancaster, CA 93535For Sale
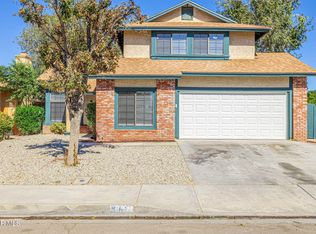 MLS ID #26008006, Michael Watson. GAVAR
- $459,9004 bd3 ba1.9k sqft44636 17th St E #E, Lancaster, CA 93535For Sale
 MLS ID #SR26195131, Christie Limpus, Berkshire Hathaway HomeServices Troth, Realtors. CRMLS
