Property has mature trees, smoothtop stove with built-in matching microwave.
Foreclosed
Street View
Est. $148,800
4423 Burkegate Dr, Spring, TX 77373
3beds
0baths
1,641sqft
SingleFamily
Built in 1979
6,751 Square Feet Lot
$148,800 Zestimate®
$91/sqft
$26/mo HOA
Overview
- 125 days
- 21
- 0
Facts & features
Interior
Bedrooms & bathrooms
- Bedrooms: 3
- Bathrooms: 0
Heating
- Other
Cooling
- Central
Features
- Has fireplace: Yes
- Fireplace features: masonry
Interior area
- Total interior livable area: 1,641 sqft
Property
Parking
- Parking features: Garage
Features
- Exterior features: Stone, Brick, Cement / Concrete
Lot
- Size: 6,751 Square Feet
Details
- Parcel number: 1077800000032
Construction
Type & style
- Home type: SingleFamily
Materials
- masonry
- Foundation: Slab
Condition
- Year built: 1979
Community & HOA
HOA
- Has HOA: Yes
- HOA fee: $26 monthly
Location
- Region: Spring
Financial & listing details
- Price per square foot: $91/sqft
- Tax assessed value: $243,925
- Annual tax amount: $1,790
Foreclosure details
Estimated market value
$148,800
$121,000 - $176,000
$1,645/mo
Price history
| Date | Event | Price |
|---|---|---|
| 7/7/2026 | Sold | -- |
Source: Public Record Report a problem | ||
| 10/1/2025 | Listing removed | $270,000$165/sqft |
Source:  HAR #34101485 Report a problem | ||
| 12/31/2024 | Price change | $270,000-1.8%$165/sqft |
Source: HAR #34101485 Report a problem | ||
| 12/6/2024 | Price change | $274,999-1.8%$168/sqft |
Source: HAR #34101485 Report a problem | ||
| 10/9/2024 | Price change | $279,999-3.4%$171/sqft |
Source: HAR #34101485 Report a problem | ||
| 9/22/2024 | Listed for sale | $289,999+11.5%$177/sqft |
Source: HAR #34101485 Report a problem | ||
| 6/3/2022 | Sold | -- |
Source: Agent Provided Report a problem | ||
| 5/6/2022 | Pending sale | $260,000$158/sqft |
Source: HAR #8820933 Report a problem | ||
| 4/29/2022 | Listed for sale | $260,000+58.5%$158/sqft |
Source: HAR #8820933 Report a problem | ||
| 1/29/2022 | Listing removed | -- |
Source: HAR #96707639 Report a problem | ||
| 1/19/2022 | Pending sale | $164,000$100/sqft |
Source: HAR #96707639 Report a problem | ||
| 12/23/2021 | Listed for sale | $164,000$100/sqft |
Source: HAR #96707639 Report a problem | ||
| 12/17/2021 | Pending sale | $164,000$100/sqft |
Source: HAR #96707639 Report a problem | ||
| 12/4/2021 | Listed for sale | $164,000$100/sqft |
Source: HAR #96707639 Report a problem | ||
Public tax history
| Year | Property taxes | Tax assessment |
|---|---|---|
| 2025 | $1,790 -12.9% | $243,925 +1% |
| 2024 | $2,054 +9.1% | $241,568 -2.2% |
| 2023 | $1,884 +29% | $246,908 +29.6% |
| 2022 | $1,460 | $190,510 +28.6% |
| 2021 | -- | $148,093 +4% |
| 2020 | $811 +8.4% | $142,416 +8.4% |
| 2019 | $748 -61.7% | $131,398 +2.1% |
| 2018 | $1,956 | $128,657 |
| 2017 | $1,956 +13.3% | $128,657 +34.3% |
| 2016 | $1,726 +12.7% | $95,812 +10.8% |
| 2015 | $1,532 | $86,464 +14.5% |
| 2014 | $1,532 | $75,492 +22% |
| 2013 | -- | $61,889 +17.7% |
| 2012 | -- | $52,601 -20.7% |
| 2011 | -- | $66,341 -6.2% |
| 2010 | -- | $70,747 -13.2% |
| 2009 | -- | $81,467 -10.4% |
| 2007 | -- | $90,956 -4.5% |
| 2006 | -- | $95,200 |
| 2005 | -- | $95,200 |
| 2004 | -- | $95,200 +6.5% |
| 2003 | -- | $89,400 +6.2% |
| 2002 | -- | $84,200 +9.9% |
| 2001 | -- | $76,600 +15.2% |
| 2000 | -- | $66,500 |
Find assessor info on the county website
Monthly payment
Climate risks
Neighborhood: Birnam Wood


Similar homes
- $151,0003 bd2 ba1.1k sqft2211 Walnut Fair Ln, Spring, TX 77373For Sale
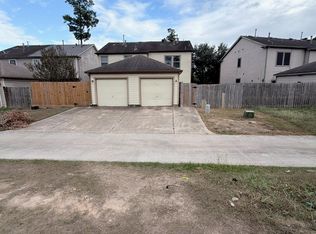 MLS ID #87710545, Jamal Abuhantesh, Royalty Realty. HAR
- $163,9003 bd2 ba1.5k sqft2303 Spring Dusk Ln, Spring, TX 77373For Sale
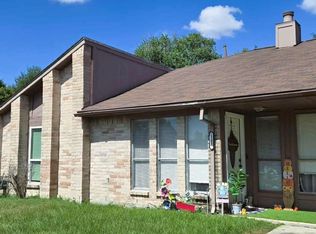 MLS ID #21858114, Martha Mendoza-Salazar, HomeSmart. HAR
- $219,9003 bd2 ba1.6k sqft23910 Farm Hill Rd, Spring, TX 77373For Sale
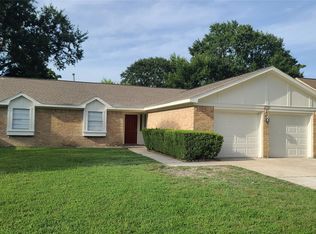 MLS ID #77009965, Will Puente, Savvy Way Realty. HAR
- $199,9993 bd3 ba1.7k sqft24022 Spring Briar Ln, Spring, TX 77373For Sale
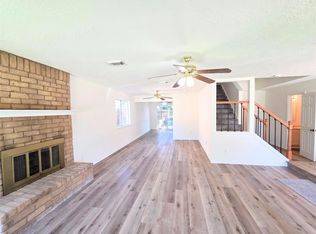 MLS ID #82543582, Elizabeth Hamilton, Segue Real Estate Group. HAR
