Welcome home to this charming 3-bedroom property tucked away on a dead-end street in a highly desirable New Bedford neighborhood, right on the Dartmouth line. Beautiful hardwood floors and abundant natural light create a warm, inviting atmosphere, while central air and a brand-new roof provide comfort and peace of mind. The finished basement offers versatile bonus space for a home office, recreation room, or cozy movie nights. Appliances are included, even a washer and dryer! A covered carport provides sheltered parking and makes unloading groceries convenient in any weather. Step outside to a spacious fenced-in backyard, perfect for summer cookouts, gardening, or relaxing with your morning coffee. With easy highway access, this home combines a peaceful neighborhood setting with everyday convenience. A wonderful opportunity to make this charming property your own!
Pending
Price cut: $10K (10/27)
$440,000
45 Pineridge St, New Bedford, MA 02740
3beds
1,100sqft
Single Family Residence
Built in 1964
10,001 Square Feet Lot
$439,400 Zestimate®
$400/sqft
$-- HOA
What's special
Central airVersatile bonus spaceCovered carportFinished basementSpacious fenced-in backyardAbundant natural lightBrand-new roof
- 42 days
- 512
- 42
Likely to sell faster than
Zillow last checked:
Listing updated:
Listed by:
Christopher Mongeon 774-992-8511,
Peak Real Estate 774-704-6877
Source: MLS PIN,MLS#: 73589384
Facts & features
Interior
Bedrooms & bathrooms
- Bedrooms: 3
- Bathrooms: 1
- Full bathrooms: 1
Heating
- Baseboard, Oil
Cooling
- Central Air
Appliances
- Included: Water Heater
Features
- Basement: Finished
- Has fireplace: No
Interior area
- Total structure area: 1,100
- Total interior livable area: 1,100 sqft
- Finished area above ground: 1,100
Property
Parking
- Total spaces: 6
- Parking features: Carport, Paved Drive, Off Street
- Garage spaces: 2
- Has carport: Yes
- Uncovered spaces: 4
Lot
- Size: 10,001 Square Feet
- Features: Cleared
Details
- Parcel number: M:0121 L:0091,2903058
- Zoning: RA
Construction
Type & style
- Home type: SingleFamily
- Architectural style: Ranch
- Property subtype: Single Family Residence
Materials
- Foundation: Concrete Perimeter
Condition
- Year built: 1964
Utilities & green energy
- Electric: 100 Amp Service
- Sewer: Public Sewer
- Water: Public
Community & HOA
Community
- Features: Public Transportation, Shopping, Tennis Court(s), Park, Walk/Jog Trails, Golf, Medical Facility, Laundromat, Bike Path, Highway Access, House of Worship, Marina, Private School, Public School, T-Station, University
HOA
- Has HOA: No
Location
- Region: New Bedford
Financial & listing details
- Price per square foot: $400/sqft
- Tax assessed value: $359,700
- Annual tax amount: $4,068
- Date on market: 10/11/2026
Estimated market value
$439,400
$409,000 - $466,000
$2,353/mo
Price history
| Date | Event | Price |
|---|---|---|
| 11/3/2026 | Pending sale | $440,000$400/sqft |
Source: MLS PIN #73589384 Report a problem | ||
| 10/27/2026 | Price change | $440,000-2.2%$400/sqft |
Source: MLS PIN #73589384 Report a problem | ||
| 10/11/2026 | Listed for sale | $450,000$409/sqft |
Source: MLS PIN #73589384 Report a problem | ||
Public tax history
| Year | Property taxes | Tax assessment |
|---|---|---|
| 2025 | $4,068 +6.5% | $359,700 +13% |
| 2024 | $3,821 -0.6% | $318,400 +18.4% |
| 2023 | $3,843 +7.6% | $268,900 +17.1% |
| 2022 | $3,570 +1.7% | $229,700 +2% |
| 2021 | $3,512 -0.8% | $225,300 +2.9% |
| 2020 | $3,539 +1.5% | $219,000 +3.5% |
| 2019 | $3,485 -3.4% | $211,600 -2.5% |
| 2018 | $3,609 +5.2% | $217,000 +5.5% |
| 2017 | $3,431 +5.7% | $205,600 +4.5% |
| 2016 | $3,245 +5.8% | $196,800 +1% |
| 2015 | $3,066 +3.4% | $194,900 -0.3% |
| 2014 | $2,964 -1.2% | $195,500 -6.6% |
| 2013 | $3,001 +2% | $209,400 -2.1% |
| 2012 | $2,943 +4.8% | $213,900 -1.9% |
| 2011 | $2,808 +1% | $218,000 -5.7% |
| 2010 | $2,780 +3.2% | $231,100 -1.8% |
| 2009 | $2,694 +7.3% | $235,300 -1.1% |
| 2008 | $2,511 +4.5% | $238,000 +2.1% |
| 2007 | $2,402 +7.4% | $233,000 +13.2% |
| 2006 | $2,237 +6% | $205,800 +10.9% |
| 2005 | $2,110 +12% | $185,600 +21.9% |
| 2004 | $1,884 -18.2% | $152,300 -3% |
| 2003 | $2,302 +29.9% | $157,000 +36.5% |
| 2002 | $1,772 +1% | $115,000 +6.4% |
| 2000 | $1,754 +17.9% | $108,100 -3.6% |
| 1996 | $1,488 | $112,100 |
Find assessor info on the county website
Monthly payment
Est. payment
Payment breakdown
Explore the cost of this home by adjusting the details. Changes won't be saved.Climate risks
Neighborhood: 02740

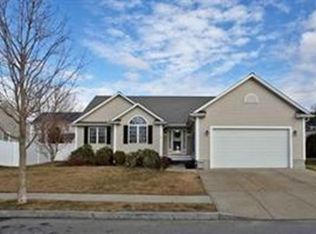
Similar homes
- $--3 bd1 ba1.3k sqft1 Tilton St, New Bedford, MA 02740Auction
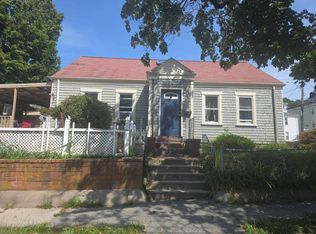 Auction.com 2
- $450,0003 bd1 ba1k sqft62 Easton St, New Bedford, MA 02746For Sale
 MLS ID #73600416, Josiah Cordero, RE/MAX Vantage. MLS PIN
- $449,9004 bd2 ba1.5k sqft46 Park St, New Bedford, MA 02740For Sale
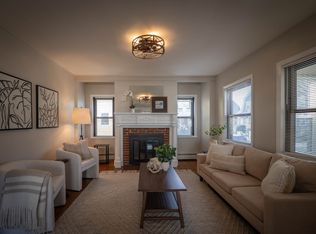 MLS ID #73602803, Carlos Mota, Silva Realty Group, Inc.. MLS PIN
- $419,0004 bd1 ba1.2k sqft326 Cedar St, New Bedford, MA 02740For Sale
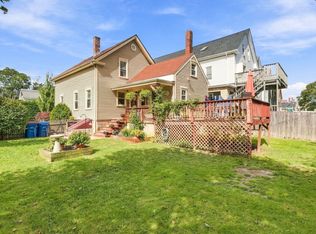 MLS ID #73580236, Melisa Gagne, RE/MAX Vantage. MLS PIN
