$290,200
3 bd|1 ba|1k sqft
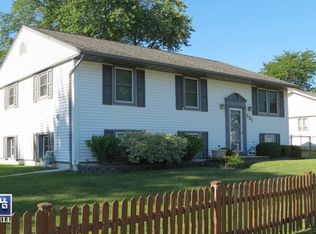
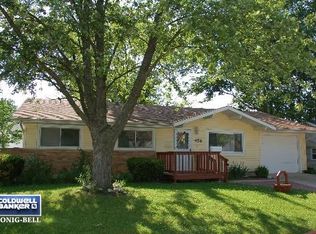
456 Berkshire Ave, Romeoville, IL 60446
Off Market
Zillow last checked:
Listing updated:
Michael Bempah (630)863-3139,
Real Broker LLC
Not available
Estimated sales range
Not available
Not available
| Date | Event | Price |
|---|---|---|
| 5/20/2026 | Contingent | $294,900$292/sqft |
Source: MRED as distributed by MLS GRID #12634043 Report a problem | ||
| 4/30/2026 | Listed for sale | $294,900+85.5%$292/sqft |
Source: | ||
| 8/6/2017 | Sold | $159,000-0.6%$157/sqft |
Source: | ||
| 7/13/2017 | Pending sale | $159,900$158/sqft |
Source: ASAP Realty #09673351 Report a problem | ||
| 7/10/2017 | Listed for sale | $159,900$158/sqft |
Source: ASAP Realty #09673351 Report a problem | ||
| 7/2/2017 | Pending sale | $159,900$158/sqft |
Source: ASAP Realty #09673351 Report a problem | ||
| 6/28/2017 | Listed for sale | $159,900+61.5%$158/sqft |
Source: ASAP Realty #09673351 Report a problem | ||
| 3/22/2017 | Sold | $99,000$98/sqft |
Source: Public Record Report a problem | ||
| 11/11/2016 | Listing removed | -- |
Source: Auction.com Report a problem | ||
| 10/15/2016 | Listed for sale | -- |
Source: Auction.com Report a problem | ||
| Year | Property taxes | Tax assessment |
|---|---|---|
| 2024 | $5,940 +7.3% | $75,533 +11.1% |
| 2023 | $5,535 +9.4% | $67,962 +13.7% |
| 2022 | $5,060 +5.6% | $59,778 +6.9% |
| 2021 | $4,791 +3% | $55,894 +3.4% |
| 2020 | $4,651 +6.6% | $54,056 +7.1% |
| 2019 | $4,362 +8.4% | $50,472 +8.7% |
| 2018 | $4,023 +6.3% | $46,437 +5.5% |
| 2017 | $3,786 +4.4% | $44,016 +5.1% |
| 2016 | $3,624 +12.5% | $41,900 +4.2% |
| 2015 | $3,221 | $40,200 +9.8% |
| 2014 | $3,221 +3.8% | $36,600 |
| 2013 | $3,104 -2.1% | $36,600 -8% |
| 2012 | $3,171 +6.5% | $39,800 -4.6% |
| 2011 | $2,977 -15.9% | $41,700 -21.9% |
| 2010 | $3,541 +6.1% | $53,400 |
| 2009 | $3,337 -0.5% | $53,400 -5% |
| 2008 | $3,355 | $56,200 +4.1% |
| 2007 | -- | $54,000 +4.9% |
| 2006 | $3,272 +6.5% | $51,500 +10% |
| 2005 | $3,072 +17.6% | $46,800 +15% |
| 2004 | $2,613 +2.3% | $40,700 +4.6% |
| 2003 | $2,553 +16.4% | $38,900 +20.1% |
| 2002 | $2,193 -4.7% | $32,400 |
| 2001 | $2,302 +21.2% | $32,400 +13.7% |
| 2000 | $1,899 | $28,500 |
Find assessor info on the county website
Source: MRED as distributed by MLS GRID. This data may not be complete. We recommend contacting the local school district to confirm school assignments for this home.
A local agent can set up tours, give advice and negotiate with sellers.