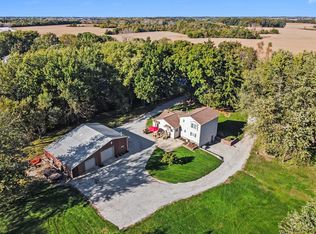
$296,500
3 bd2 ba1.8k sqft
508 Cardinal Dr, Crown Point, IN 46307
Off Market
Likely to sell faster than
Zillow last checked:
Listing updated:
Holly Furdo,
Better Homes and Gardens Real 219-999-8990

$655,000
$622,000 - $688,000
$3,358/mo
| Date | Event | Price |
|---|---|---|
| 11/13/2026 | Listed for sale | $689,900+17.1%$192/sqft |
Source:  NIRA as distributed by MLS GRID #847972 Report a problem | ||
| 6/21/2022 | Sold | $589,000-1.7%$164/sqft |
Source: NIRA as distributed by MLS GRID #510474 Report a problem | ||
| 5/9/2022 | Price change | $599,000-2.6%$167/sqft |
Source: NIRA as distributed by MLS GRID #510474 Report a problem | ||
| 4/23/2022 | Price change | $615,000-1.6%$171/sqft |
Source: NIRA as distributed by MLS GRID #510474 Report a problem | ||
| 4/18/2022 | Listed for sale | $625,000+140.4%$174/sqft |
Source: NIRA as distributed by MLS GRID #510474 Report a problem | ||
| 9/30/2009 | Sold | $260,000-34.2%$72/sqft |
Source: NIRA as distributed by MLS GRID #216392 Report a problem | ||
| 6/19/2008 | Listed for sale | $395,000$110/sqft |
Source: NRT Chicago #216392 Report a problem | ||
| Year | Property taxes | Tax assessment |
|---|---|---|
| 2025 | $6,852 +6.8% | $675,400 +9% |
| 2024 | $6,417 +37% | $619,900 +9.2% |
| 2023 | $4,684 +5.4% | $567,500 +36.9% |
| 2022 | $4,445 +4% | $414,400 +5% |
| 2021 | $4,272 +1.8% | $394,600 +4.1% |
| 2020 | $4,195 -48.8% | $379,000 +1.9% |
| 2019 | $8,187 +58.5% | $372,100 +1.4% |
| 2018 | $5,167 +24.6% | $366,900 +4.5% |
| 2017 | $4,148 | $351,100 +6.5% |
| 2016 | $4,148 +1.3% | $329,800 +10.3% |
| 2014 | $4,096 +1.7% | $298,900 +2.3% |
| 2013 | $4,029 -31.1% | $292,200 -19.7% |
| 2012 | $5,843 +18% | $364,000 +17.9% |
| 2011 | $4,953 +6.9% | $308,700 -3.5% |
| 2010 | $4,632 | $319,900 -2.6% |
| 2009 | -- | $328,500 +15.1% |
| 2007 | -- | $285,400 +26.3% |
| 2006 | -- | $225,900 |
| 2005 | -- | $225,900 |
| 2004 | -- | $225,900 +119.5% |
| 2003 | -- | $102,900 |
| 2002 | -- | $102,900 +200% |
| 2001 | -- | $34,300 |
Source: NIRA as distributed by MLS GRID. This data may not be complete. We recommend contacting the local school district to confirm school assignments for this home.
A local agent can set up tours, give advice and negotiate with sellers.
A local lender can help you make sure your offer is ready when you are.