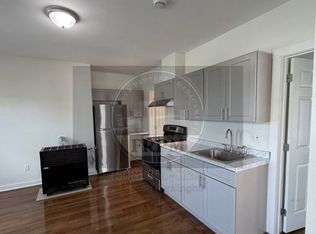
3-Family Home in New Bedford North, offering over 4,100 square feet of total living area! Generously sized units feature large bedrooms, eat-in kitchens and double parlors, providing the kind of room that's not always easy to find in a multifamily. Whether you're looking to owner-occupy or add to your investment portfolio, the spacious layouts offer plenty of possibilities. Additional highlights include off-street parking and a vinyl-sided exterior, and is within just a few miles of the Church Street MBTA station. Conveniently located with easy access to shopping, dining, public transportation and area amenities. A great opportunity to own a sizable three-family in New Bedford!
Under contract
Price cut: $10K (10/21)
$669,900
47 Holly St, New Bedford, MA 02746
9beds
4,167sqft
3 Family
Built in 1908
-- sqft lot
$663,600 Zestimate®
$161/sqft
$-- HOA
What's special
Vinyl-sided exteriorOff-street parkingDouble parlorsEat-in kitchensLarge bedroomsGenerously sized units
- 49 days
- 216
- 15
Zillow last checked:
Listing updated:
Listed by:
Carlos Mota 508-400-0005,
Silva Realty Group, Inc. 508-536-9507
Source: MLS PIN,MLS#: 73581404
Facts & features
Interior
Bedrooms & bathrooms
- Bedrooms: 9
- Bathrooms: 3
- Full bathrooms: 3
Features
- Basement: Full,Unfinished
- Has fireplace: No
Interior area
- Total structure area: 4,167
- Total interior livable area: 4,167 sqft
- Finished area above ground: 4,167
Property
Parking
- Total spaces: 2
- Parking features: Off Street
- Uncovered spaces: 2
Lot
- Size: 2,483 Square Feet
- Features: Other
Details
- Parcel number: M:0093 L:0234,2898653
- Zoning: MUB
Construction
Type & style
- Home type: MultiFamily
- Property subtype: 3 Family
Materials
- Foundation: Other
- Roof: Shingle
Condition
- Year built: 1908
Utilities & green energy
- Sewer: Public Sewer
- Water: Public
Community & HOA
Community
- Features: Sidewalks
Location
- Region: New Bedford
Financial & listing details
- Price per square foot: $161/sqft
- Tax assessed value: $547,100
- Annual tax amount: $6,188
- Date on market: 9/22/2026
- Listing terms: Other (See Remarks)
- Total actual rent: 6800
- Road surface type: Paved
Estimated market value
$663,600
$630,000 - $697,000
$2,061/mo
Price history
| Date | Event | Price |
|---|---|---|
| 11/1/2026 | Contingent | $669,900$161/sqft |
Source: MLS PIN #73581404 Report a problem | ||
| 10/21/2026 | Price change | $669,900-1.5%$161/sqft |
Source: MLS PIN #73581404 Report a problem | ||
| 9/23/2026 | Listed for sale | $679,900+288.5%$163/sqft |
Source: MLS PIN #73581404 Report a problem | ||
| 2/18/2009 | Sold | $175,000+775%$42/sqft |
Source: Public Record Report a problem | ||
| 11/29/1995 | Sold | $20,000-87.1%$5/sqft |
Source: Public Record Report a problem | ||
| 8/15/1989 | Sold | $155,000$37/sqft |
Source: Public Record Report a problem | ||
Public tax history
| Year | Property taxes | Tax assessment |
|---|---|---|
| 2025 | $6,188 +14.3% | $547,100 +21.3% |
| 2024 | $5,412 +13.9% | $451,000 +35.6% |
| 2023 | $4,753 +9.7% | $332,600 +19.3% |
| 2022 | $4,331 +2.6% | $278,700 +2.9% |
| 2021 | $4,222 +0.9% | $270,800 +4.6% |
| 2020 | $4,184 +17.2% | $258,900 +19.5% |
| 2019 | $3,569 +5.6% | $216,700 +6.6% |
| 2018 | $3,379 +8.8% | $203,200 +9.2% |
| 2017 | $3,106 +4.6% | $186,100 +3.4% |
| 2016 | $2,968 +6.5% | $180,000 +1.6% |
| 2015 | $2,786 +2% | $177,100 -1.7% |
| 2014 | $2,732 -2.1% | $180,200 -7.4% |
| 2013 | $2,790 -0.5% | $194,700 -4.5% |
| 2012 | $2,804 -6.8% | $203,800 -12.7% |
| 2011 | $3,007 -7.3% | $233,500 -13.4% |
| 2010 | $3,243 +1.6% | $269,600 -3.3% |
| 2009 | $3,192 +4.2% | $278,800 -4% |
| 2008 | $3,063 +2.3% | $290,300 |
| 2007 | $2,993 +28.7% | $290,300 +35.7% |
| 2006 | $2,326 +2.8% | $214,000 +7.5% |
| 2005 | $2,263 +6.9% | $199,000 +16.3% |
| 2004 | $2,117 +29.2% | $171,100 +53% |
| 2003 | $1,639 +3.1% | $111,800 +8.4% |
| 2002 | $1,589 +5.9% | $103,100 +11.6% |
| 2000 | $1,500 +72.2% | $92,400 +40.9% |
| 1996 | $871 | $65,600 |
Find assessor info on the county website
Monthly payment
Est. payment
Payment breakdown
Explore the cost of this home by adjusting the details. Changes won't be saved.Climate risks
Neighborhood: 02746
Similar homes
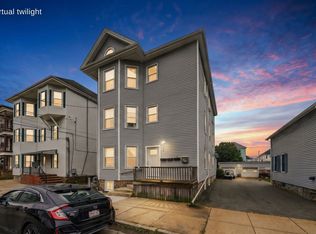
- $679,90011 bd4 ba4.9k sqft338 Ashley Blvd, New Bedford, MA 02746For Sale
 MLS ID #73599614, Paula M. Almeida, Almeida Realty Group. MLS PIN
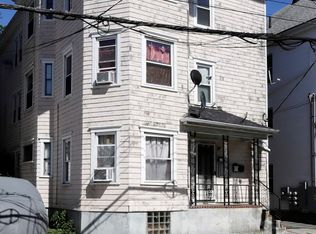
- $680,0009 bd3 ba3.4k sqft270 Tinkham St, New Bedford, MA 02746For Sale
 MLS ID #73598701, Miguel Miranda, DRM Real Estate, Inc. MLS PIN
- $590,0009 bd3 ba3.9k sqft178 Ashley Blvd, New Bedford, MA 02746For Sale
 MLS ID #73539485, Zachary Clough, Coastal Realty. MLS PIN
- $750,00010 bd6 ba4.2k sqft56 Nye St, New Bedford, MA 02746For Sale
 MLS ID #73592004, Leovanni Baessa, Compass. MLS PIN
- $585,0008 bd3 ba3k sqft143 Division St, New Bedford, MA 02744For Sale
 MLS ID #1420815, Shanika Hodge, Real Broker, LLC. StateWide MLS RI
