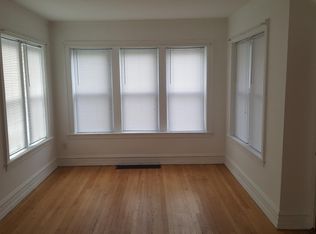
Estate Sale sold AS-IS. 2unit with finished basement 2.5 car garage. Hardwood Floors on 1st and 2nd floor.Beasement has In-low arrangement needs litte tlc. Exelent location close to Six Corners Shopping. Close to schools,transportation I 90/94.
Active
$479,900
4857 W Warwick Ave, Chicago, IL 60641
3beds
--sqft
Multi Family
Built in ----
-- sqft lot
$474,600 Zestimate®
$--/sqft
$-- HOA
What's special
- 6 days
- 319
- 12
Zillow last checked:
Listing updated:
Listed by:
Teresa De la Cruz 773-775-0600,
RE/MAX City
Source: MRED as distributed by MLS GRID,MLS#: 12798933
Facts & features
Interior
Bedrooms & bathrooms
- Bedrooms: 3
- Bathrooms: 2
- Full bathrooms: 3
Heating
- Has Heating (Unspecified Type)
Features
- Basement: Finished,Full
Property
Parking
- Total spaces: 2
- Parking features: Yes, Detached, Garage
- Garage spaces: 2
Lot
- Size: 3,750 Square Feet
- Dimensions: 30x125
Details
- Parcel number: 13212230020000
- Special conditions: List Broker Must Accompany
Construction
Type & style
- Home type: MultiFamily
- Property subtype: Multi Family
Materials
- Brick
Condition
- New construction: No
Utilities & green energy
- Sewer: Public Sewer
- Water: Lake Michigan
Community & HOA
Location
- Region: Chicago
Financial & listing details
- Tax assessed value: $360,000
- Annual tax amount: $4,466
- Date on market: 11/8/2026
- Ownership: Fee Simple
Estimated market value
$474,600
$451,000 - $498,000
$2,484/mo
Price history
| Date | Event | Price |
|---|---|---|
| 11/8/2026 | Listed for sale | $479,900 |
Source:  MRED as distributed by MLS GRID #12798933 Report a problem | ||
Public tax history
| Year | Property taxes | Tax assessment |
|---|---|---|
| 2024 | $4,603 +13.6% | $36,000 +9.1% |
| 2023 | $4,053 -26.6% | $32,999 |
| 2022 | $5,524 +1.7% | $32,999 |
| 2021 | $5,434 +13% | $32,999 +21.5% |
| 2020 | $4,808 -1.7% | $27,153 -11% |
| 2019 | $4,892 +1.8% | $30,509 |
| 2018 | $4,808 +0.3% | $30,509 +19.1% |
| 2017 | $4,792 +3.4% | $25,622 |
| 2016 | $4,634 +9.9% | $25,622 |
| 2015 | $4,217 +4.3% | $25,622 +5.3% |
| 2014 | $4,041 +2.3% | $24,334 |
| 2013 | $3,950 +0.7% | $24,334 |
| 2012 | $3,922 -10.8% | $24,334 -21.9% |
| 2011 | $4,397 +2.6% | $31,154 |
| 2010 | $4,284 +8.8% | $31,154 |
| 2009 | $3,936 -3.2% | $31,154 -11.1% |
| 2008 | $4,065 +10.5% | $35,031 |
| 2007 | $3,680 +26.4% | $35,031 |
| 2006 | $2,910 -8.4% | $35,031 +30.9% |
| 2005 | $3,178 +3.4% | $26,756 |
| 2004 | $3,074 +4.2% | $26,756 |
| 2003 | $2,950 +8.2% | $26,756 +57.5% |
| 2002 | $2,727 +5% | $16,984 |
| 2001 | $2,596 +7% | $16,984 |
| 2000 | $2,425 -0.2% | $16,984 +16.3% |
| 1999 | $2,429 | $14,599 |
Find assessor info on the county website
Monthly payment
Est. payment
Payment breakdown
Explore the cost of this home by adjusting the details. Changes won't be saved.Climate risks
Neighborhood: Portage Park
Nearby schools
Similar homes
- $--4 bd2 ba2.7k sqft5040 W Wellington Ave, Chicago, IL 60641Auction
 Auction.com 2
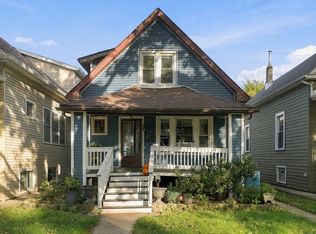
- $475,0004 bd2 ba-- sqft3431 N Keating Ave, Chicago, IL 60641Active
 MLS ID #12794332, Antonio Sarmiento, 606 Brokers LLC. MRED as distributed by MLS GRID
- $499,9003 bd2 ba3k sqft4850 W Waveland Ave, Chicago, IL 60641Active
 MLS ID #12778153, Dulce Ramos, Chicago Sweet Homes Realty Inc. MRED as distributed by MLS GRID
- $599,9994 bd2 ba-- sqft5018 W Irving Park Rd, Chicago, IL 60641New
 MLS ID #12802913, Francisco Chajon, Epique Realty Inc. MRED as distributed by MLS GRID
