This is a 2831 square foot, single family home. This home is located at 5 Davenport Rd, Newfoundland, NJ 07435.
Pre-foreclosure
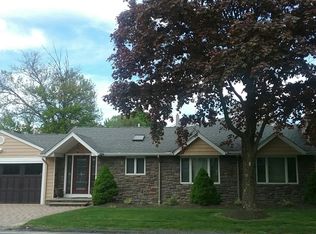
Street View
Est. $801,300
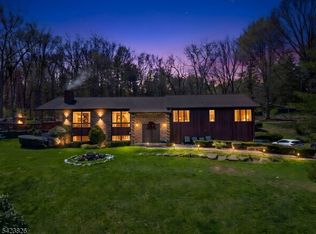
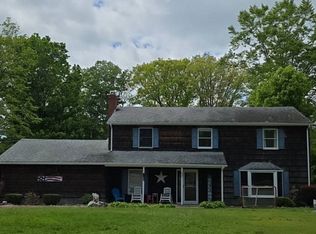
5 Davenport Rd, Newfoundland, NJ 07435
--beds
--baths
2,831sqft
SingleFamily
Built in 1959
8,407 Square Feet Lot
$801,300 Zestimate®
$283/sqft
$69/mo HOA
Overview
- 79 days |
- 5 |
- 0 |
Facts & features
Interior
Interior area
- Total interior livable area: 2,831 sqft
Property
Parking
- Total spaces: 1
Features
- Exterior features: Wood
Lot
- Size: 8,407 Square Feet
Details
- Parcel number: 3540302000000006
Construction
Type & style
- Home type: SingleFamily
Materials
- Frame
Condition
- Year built: 1959
Community & HOA
HOA
- Has HOA: Yes
- HOA fee: $69 monthly
Location
- Region: Newfoundland
Financial & listing details
- Price per square foot: $283/sqft
- Tax assessed value: $579,700
- Annual tax amount: $14,864
Visit our professional directory to find a foreclosure specialist in your area that can help with your home search.
Find a foreclosure agentForeclosure details
Estimated market value
$801,300
$729,000 - $881,000
$4,102/mo
Price history
| Date | Event | Price |
|---|---|---|
| 5/13/1996 | Sold | $264,500$93/sqft |
Source: Public Record Report a problem | ||
Public tax history
| Year | Property taxes | Tax assessment |
|---|---|---|
| 2025 | $14,864 +8.2% | $579,700 +8.2% |
| 2024 | $13,733 +3.6% | $535,600 +6% |
| 2023 | $13,254 +6.7% | $505,100 +10.7% |
| 2022 | $12,418 +2% | $456,200 +6.3% |
| 2021 | $12,178 +5.2% | $429,100 +3.6% |
| 2020 | $11,575 +0.7% | $414,300 +2.1% |
| 2019 | $11,489 -9.7% | $405,700 +2.4% |
| 2018 | $12,716 +1.3% | $396,300 -2.7% |
| 2017 | $12,553 +0.7% | $407,300 |
| 2016 | $12,463 +1.9% | $407,300 |
| 2015 | $12,231 +3.1% | $407,300 |
| 2014 | $11,861 +4.7% | $407,300 |
| 2012 | $11,324 +3.1% | $407,300 +29.3% |
| 2011 | $10,984 +4.6% | $314,900 |
| 2010 | $10,499 +1.7% | $314,900 |
| 2009 | $10,326 | $314,900 |
| 2008 | -- | $314,900 |
| 2007 | -- | $314,900 |
| 2006 | -- | $314,900 |
| 2005 | -- | $314,900 |
| 2004 | -- | $314,900 |
| 2003 | -- | $314,900 |
| 2002 | -- | $314,900 +119.9% |
| 2001 | -- | $143,200 |
Find assessor info on the county website
Monthly payment
Estimated monthly payment$1,822
All calculations are estimates and provided by Zillow, Inc. for informational purposes only. Actual amounts may vary.
HOA fees may include property taxes on listings classified as Co-Ops. Contact the listing agent and/or owner for fee details.
Mortgage interest rates are dependent on a number of factors, including credit score, down payment, and repayment length. Interest rate data provided by Zillow Group Marketplace, Inc. as of 1/1/1970 from various mortgage lenders with which we have lead or other similar arrangements; the Estimated Payment is an average of those rates.
See how much you could borrow to make a competitive offer.
Climate risks
Neighborhood: Green Pond
Nearby schools
GreatSchools rating
- 6/10Katherine D. Malone Elementary SchoolGrades: K-5Distance: 3.8 mi
- 5/10Copeland Middle SchoolGrades: 6-8Distance: 7.3 mi
- 6/10Morris Knolls High SchoolGrades: 9-12Distance: 9.3 mi


- New Jersey
- Morris County
- Newfoundland
- 07435
- Green Pond
- 5 Davenport Rd
Nearby cities
Nearby neighborhoods
Nearby zip codes
Other Newfoundland Topics
