This home located in the quiet town of Rosedale, just minutes from Terre Haute, offers 3 bedrooms, 2 baths, and an oversized 2 car garage. If you are in the market for a home that needs some TLC to make your own, this is the one! It has a smaller fenced in yard, for minimal upkeep, yet has plenty of room for children and pets to run and play. The kitchen has stainless steel appliances, and the family room is a great space for family/friends to hang out. (Family room could be a 4th bedroom with bath). New C/A unit in 2024.
Pending
$122,500
51 E Vine St, Rosedale, IN 47874
3beds
1,240sqft
Single Family Residence
Built in 1840
-- sqft lot
$-- Zestimate®
$99/sqft
$-- HOA
What's special
Smaller fenced in yard
- 16 days
- 528
- 59
Zillow last checked:
Listed by:
Denise Buck 812-870-4894,
Newlin-Miller, REALTORSA®
Source: BHHS broker feed,MLS#: 110715
Facts & features
Interior
Bedrooms & bathrooms
- Bedrooms: 3
- Bathrooms: 2
- Full bathrooms: 2
Heating
- Natural Gas
Cooling
- Central Air
Appliances
- Included: Dishwasher, Dryer, Refrigerator, Washer
Features
- Has basement: No
Interior area
- Total structure area: 1,240
- Total interior livable area: 1,240 sqft
Property
Features
- Patio & porch: Patio
Details
- Parcel number: 611434206005000004
Construction
Type & style
- Home type: SingleFamily
- Property subtype: Single Family Residence
Materials
- Vinyl
- Roof: Shake
Condition
- Year built: 1840
Community & HOA
Location
- Region: Rosedale
Financial & listing details
- Price per square foot: $99/sqft
- Tax assessed value: $84,000
- Annual tax amount: $209
- Date on market: 10/11/2026
- Lease term: Contact For Details
Estimated market value
Not available
Estimated sales range
Not available
$1,328/mo
Price history
| Date | Event | Price |
|---|---|---|
| 10/22/2026 | Pending sale | $122,500$99/sqft |
Source: BHHS broker feed #110715 Report a problem | ||
| 10/11/2026 | Listed for sale | $122,500-15.8%$99/sqft |
Source:  THAAR #110715 Report a problem | ||
| 7/14/2026 | Listing removed | $145,500$117/sqft |
Source: BHHS broker feed #109272 Report a problem | ||
| 5/19/2026 | Price change | $145,500-9%$117/sqft |
Source: THAAR #109272 Report a problem | ||
| 5/7/2026 | Listed for sale | $159,900+77.9%$129/sqft |
Source: THAAR #109272 Report a problem | ||
| 9/5/2022 | Sold | $89,900$73/sqft |
Source:  MIBOR as distributed by MLS GRID #21837554 Report a problem | ||
| 7/17/2022 | Pending sale | $89,900$73/sqft |
Source: MIBOR as distributed by MLS GRID #21837554 Report a problem | ||
| 7/1/2022 | Price change | $89,900-5.3%$73/sqft |
Source: THAAR #97522 Report a problem | ||
| 6/5/2022 | Pending sale | $94,900-5%$77/sqft |
Source: MIBOR as distributed by MLS GRID #21837554 Report a problem | ||
| 5/28/2022 | Price change | $99,900+5.3%$81/sqft |
Source: THAAR #97522 Report a problem | ||
| 5/25/2022 | Price change | $94,900-5%$77/sqft |
Source: MIBOR as distributed by MLS GRID #21837554 Report a problem | ||
| 5/5/2022 | Listed for sale | $99,900$81/sqft |
Source: MIBOR as distributed by MLS GRID #21837554 Report a problem | ||
| 4/25/2022 | Pending sale | $99,900$81/sqft |
Source: MIBOR as distributed by MLS GRID #21837554 Report a problem | ||
| 4/17/2022 | Listed for sale | $99,900$81/sqft |
Source: THAAR #97522 Report a problem | ||
| 3/15/2022 | Pending sale | $99,900$81/sqft |
Source: MIBOR as distributed by MLS GRID #21837554 Report a problem | ||
| 2/13/2022 | Listed for sale | $99,900$81/sqft |
Source: MIBOR as distributed by MLS GRID #21837554 Report a problem | ||
Public tax history
| Year | Property taxes | Tax assessment |
|---|---|---|
| 2025 | $209 -7.1% | $84,000 +26.7% |
| 2024 | $225 +2892% | $66,300 +0.2% |
| 2023 | $8 -48.1% | $66,200 +7.8% |
| 2022 | $14 +75.7% | $61,400 +18.5% |
| 2021 | $8 +64.8% | $51,800 +3.4% |
| 2020 | $5 | $50,100 +3.9% |
| 2019 | -- | $48,200 +1.7% |
| 2018 | -- | $47,400 +0.6% |
| 2017 | -- | $47,100 -0.6% |
| 2016 | -- | $47,400 +10% |
| 2014 | -- | $43,100 -0.2% |
| 2013 | -- | $43,200 +0.7% |
| 2012 | -- | $42,900 +9.4% |
| 2011 | -- | $39,200 +2.1% |
| 2010 | $104 -11.7% | $38,400 |
| 2009 | $118 -83.9% | $38,400 +11.6% |
| 2007 | $733 -13.4% | $34,400 +9.6% |
| 2006 | $847 | $31,400 |
Find assessor info on the county website
Monthly payment
Est. payment
Payment breakdown
Explore the cost of this home by adjusting the details. Changes won't be saved.Climate risks
Neighborhood: 47874

Similar homes
- $174,9003 bd2 ba1.2k sqft314 N Depot St, Rosedale, IN 47874For Sale
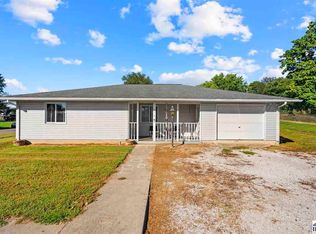
 MLS ID #110645, OWEN TIPTON, GIBSON REAL ESTATE, INC.. THAAR
- $135,0002 bd2 ba1.4k sqft3084 E Webster St, Rosedale, IN 47874Active
 MLS ID #22116397, Christopher Skillern, F.C. Tucker Advantage, REALTOR. MIBOR as distributed by MLS GRID
- $115,9003 bd2 ba1.4k sqft840 Walnut St, Clinton, IN 47842For Sale
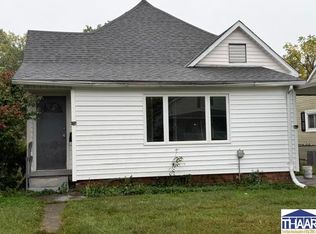 MLS ID #110757, JANE STRECKER, REMAX R.E.A.. THAAR
- $114,9003 bd1 ba1.2k sqft226 S 15th St, Terre Haute, IN 47807For Sale
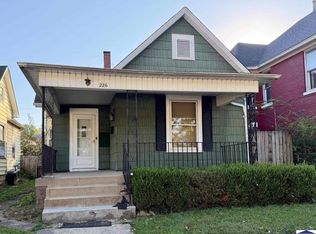 MLS ID #110822, JULIE WEIR, REMAX R.E.A.. THAAR
- $129,9003 bd1 ba1.2k sqft2814 Washington Ave, Terre Haute, IN 47803For SaleMLS ID #110770, KATHI KENNEDY, CENTURY 21 ELITE. THAAR
- $129,9003 bd1 ba1.7k sqft215 N 6th St, Clinton, IN 47842For SaleMLS ID #110035, LAUREN COONS, COMPLETE LANDLORD SOLUTIONS. THAAR
- $125,0001 bd1 ba1.1k sqft911 N 37th St, Terre Haute, IN 47803For SaleMLS ID #108044, TY COTTRELL, MOSSY OAK PROPERTIES INDIANA LAND AND LIFESTYLE. THAAR
- $127,0002 bd1 ba1k sqft2415 Garfield Ave, Terre Haute, IN 47804For SaleMLS ID #110764, SPENCER SCOTT, 12 POINTS REAL ESTATE. THAAR
- $129,0003 bd2 ba990 sqft3100 N 14th St, Terre Haute, IN 47804For SaleMLS ID #110318, AHARON BATSON, THE REAL ESTATE CONNECTION. THAAR
- $125,0001 bd2 ba875 sqft2710 Jefferson St, Terre Haute, IN 47802For SaleMLS ID #110769, SANDRA SCAMIHORN, REMAX R.E.A.. THAAR
- $125,0002 bd1 ba1k sqft413 W York St, Rockville, IN 47872For SaleMLS ID #110620, JEREMY MONTGOMERY, REMAX R.E.A.. THAAR
- $129,9002 bd1 ba832 sqft1141 S 3rd St, Clinton, IN 47842For SaleMLS ID #110486, JANICE K CLIDIENST, SIGNATURE REAL ESTATE. THAAR
- $104,9003 bd1 ba982 sqft205 N 8th St W, West Terre Haute, IN 47885For SaleMLS ID #110763, KEVIN BEEL, GILBERT REAL ESTATE & ASSOCIATES LLC. THAAR
- $169,0002 bd1 ba1.1k sqft2201 Cross Ln, Terre Haute, IN 47805For SaleMLS ID #110809, RACHEL BACKFISH, CENTURY 21 ELITE. THAAR
